Wastewater
Solids Retention Time in Wastewater: How to Calculate SRT and Why It Controls Your Nitrification
Learn how to calculate solids retention time in wastewater, why it matters for nitrification and settling, and how to interpret SRT alongside your other process indicators.
October 9, 2026 · 6 min read
TL;DR
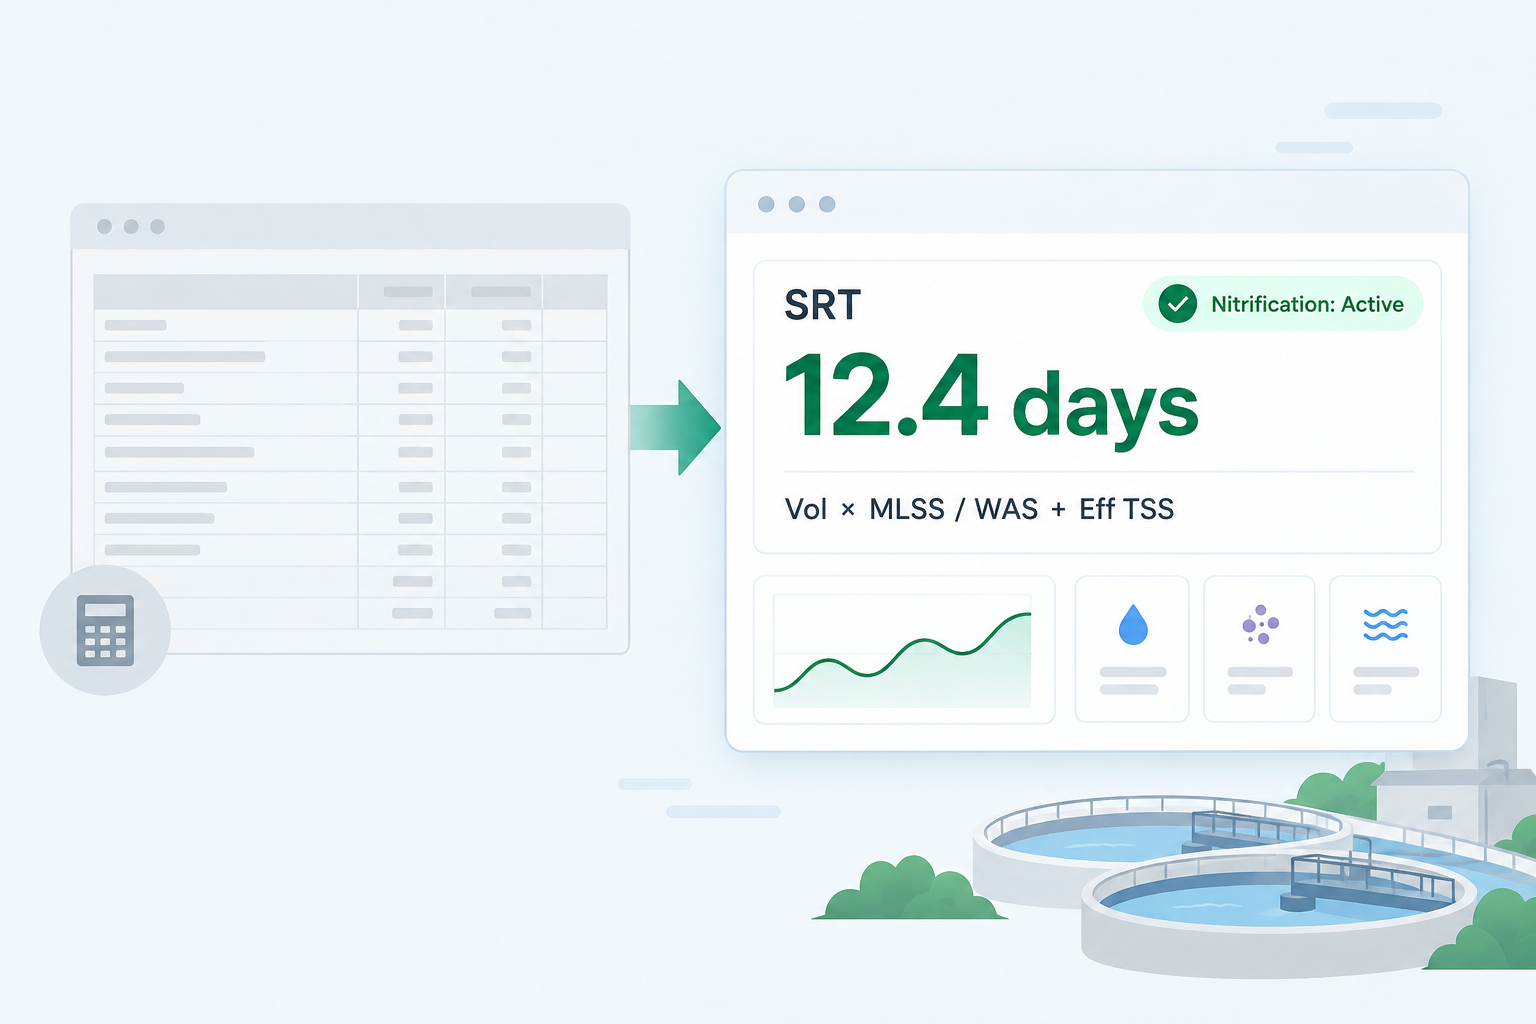
Solids retention time (SRT) is a key process-control variable in activated-sludge treatment. It estimates how long solids remain within a defined process boundary. A common aeration-basin-based calculation divides the solids inventory by the daily solids removed through wasting and lost in effluent: SRT (days) = (Vol × MLSS) ÷ (WAS flow × WAS TSS + Eff flow × Eff TSS). Use consistent volume and flow units throughout. SRT is important for biological treatment and nitrification, but the appropriate target is facility-specific and depends on temperature, DO, pH, influent characteristics, and process configuration. Review SRT alongside loading, F/M ratio, SVI, DO, and effluent results. ComplyFlo can calculate and trend SRT when the required inputs are available; operating decisions remain with qualified personnel following the plant's approved procedures.
At facilities that calculate SRT manually, staff often combine laboratory, flow, and operating records from several sources. That process is where errors tend to enter the calculation.
Why does SRT calculation break down in a manual process?
Calculating SRT manually means pulling data from multiple places. Operators take MLSS from the lab worksheet, WAS flow from the control panel log, and effluent TSS from a separate sheet. Then they apply the formula. Then they check the result against a target written on a whiteboard or in a procedure document.
That chain breaks in predictable ways. A flow entry lands in the wrong cell. Someone updates the spreadsheet template and the formula loses its reference. WAS flow comes from a pump speed reading that does not reflect actual throughput when the pump is worn or a check valve is failing. The result is an SRT trend that looks continuous but is not - and wasting decisions made from it are not as grounded as they appear.
What is the SRT formula and how do you calculate it correctly?
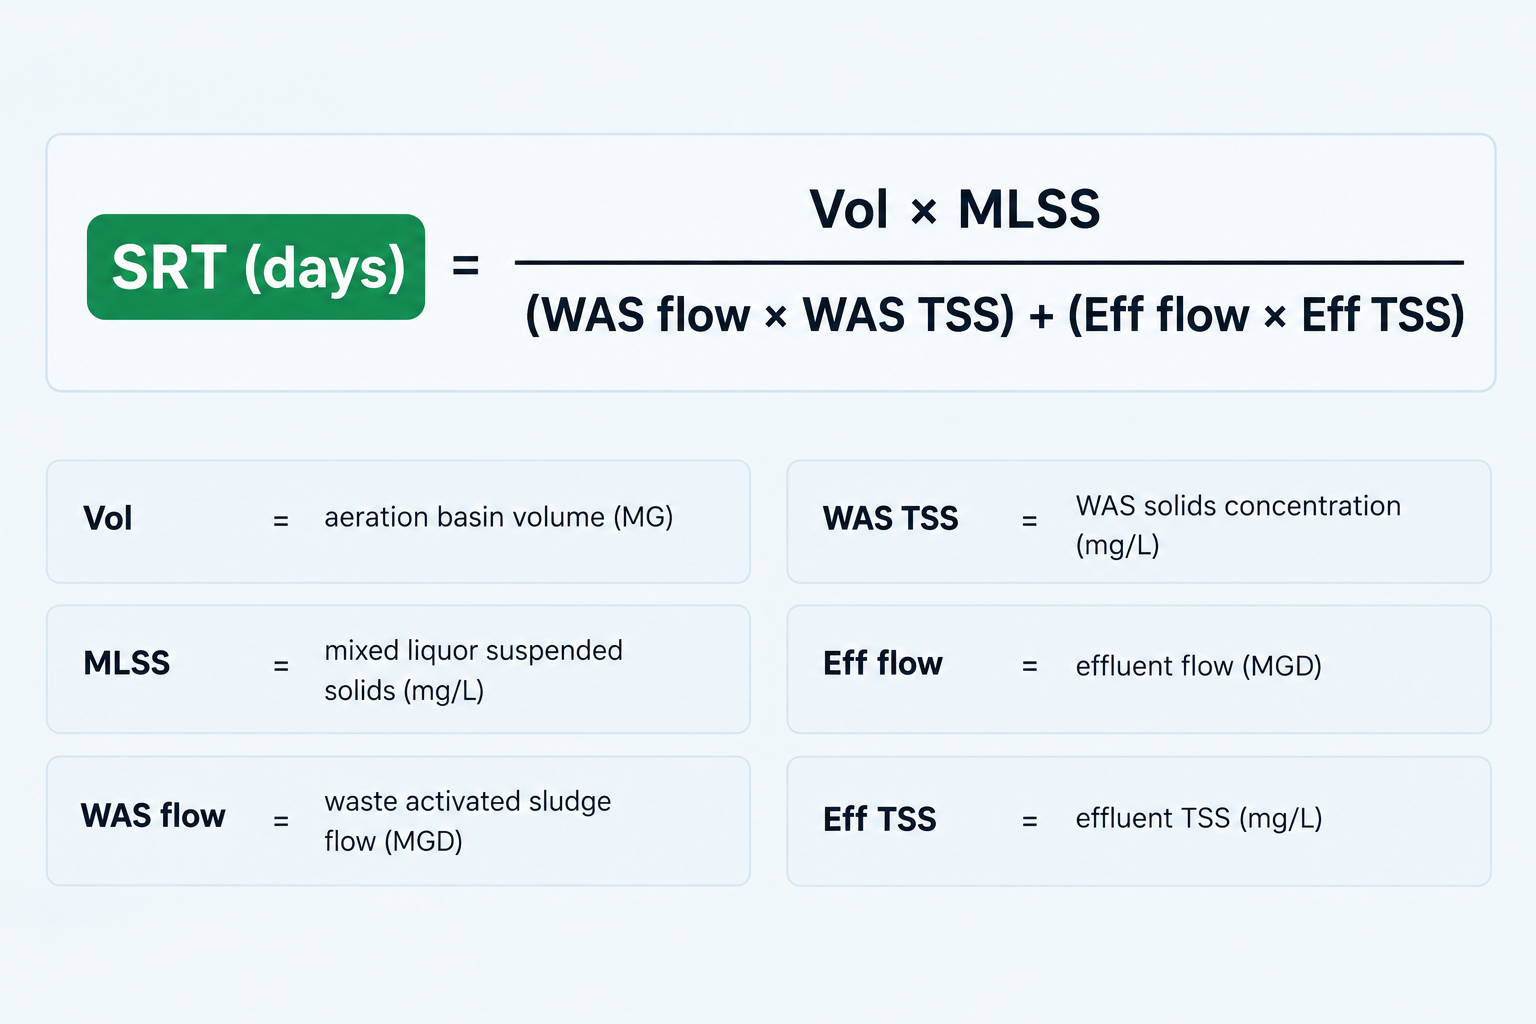
SRT estimates the average number of days biological solids remain within the defined system boundary before leaving as waste sludge or effluent. A common aeration-basin-based formula is:
SRT (days) = (Aeration Basin Volume × MLSS) ÷ [(WAS flow × WAS TSS) + (Effluent flow × Effluent TSS)]
Here is what each variable means:
Vol - aeration basin volume in MG (or gallons, as long as flows match)
MLSS - mixed liquor suspended solids in mg/L, from daily lab analysis
WAS flow - waste activated sludge flow rate in MGD (or GPD to match volume)
WAS TSS - solids concentration of the actual wasting stream in mg/L
Eff flow - average plant effluent flow in the same units as WAS flow
Eff TSS - effluent total suspended solids in mg/L
Worked example - using MG for volume and MGD for all flows:
Given values:
Active aeration volume: 1.0 MG
MLSS: 2,500 mg/L
Average WAS flow: 0.05 MGD
WAS TSS: 8,000 mg/L
Average effluent flow: 1.0 MGD
Effluent TSS: 12 mg/L
Applying the formula directly:
SRT = (1.0 × 2,500) ÷ [(0.05 × 8,000) + (1.0 × 12)] = 2,500 ÷ [400 + 12] = 2,500 ÷ 412 ≈ 6.07 days
The 8.34 lb/gallon conversion factor cancels because it appears in both the solids-inventory numerator and the solids-loss denominator. For transparency, the same result can be shown as a mass-balance calculation:
Component | Calculation | Result |
|---|---|---|
Aeration solids inventory | 1.0 MG × 2,500 mg/L × 8.34 | 20,850 lb |
WAS solids removed | 0.05 MGD × 8,000 mg/L × 8.34 | 3,336 lb/day |
Effluent solids lost | 1.0 MGD × 12 mg/L × 8.34 | 100 lb/day |
SRT | 20,850 ÷ (3,336 + 100) | ≈ 6.07 days |
If volume is entered in gallons instead of MG, both flows must also be in gallons per day for the formula to balance.
Two things to document before calculating:
First, define the calculation boundary. This example uses the aeration basin solids inventory only. Depending on the facility's process-control method, the calculation may include solids in other biological zones or secondary clarifiers. Document which inventories are included and use the same basis consistently when comparing trends and targets.
Second, confirm the waste-stream concentration. When wasting from the RAS line, the RAS TSS concentration can differ substantially from aeration-basin MLSS. Use the concentration of the actual wasting stream in the denominator, not MLSS as a proxy.
One additional mistake to watch for: using the pump speed setting as the WAS flow value. Make sure the flow figure used reflects actual pumped volume.
When all required inputs and plant configuration are available, ComplyFlo can calculate and trend SRT automatically, with the calculation boundary and wasting stream defined by the facility.
What does your SRT number mean for nitrification performance?
Your SRT is important for maintaining nitrifying bacteria in your system. Nitrifiers grow more slowly than carbon-removing organisms. They need enough time in the aeration basin to reproduce before they are wasted out. If SRT is too short relative to their growth rate, nitrifiers leave the system faster than they can replenish, and nitrification becomes unreliable.
Nitrifying organisms generally require longer solids retention than organisms responsible for carbon removal, and colder wastewater temperatures typically increase the SRT needed to sustain nitrification. According to the EPA Nutrient Control Design Manual: State of Technology Review Report, with sufficient dissolved oxygen and adequate pH, typical nitrification design SRTs range from approximately 4–7 days at 20°C and 10–20 days at 10°C. These are reference ranges from the design literature, not universal operating guarantees.
The appropriate SRT target for your plant depends on wastewater temperature, DO, pH and alkalinity, influent characteristics, treatment objectives, process configuration, and an appropriate safety margin above the theoretical minimum. Establish the operating target from the facility's design documents and validated operating history rather than applying a fixed number.
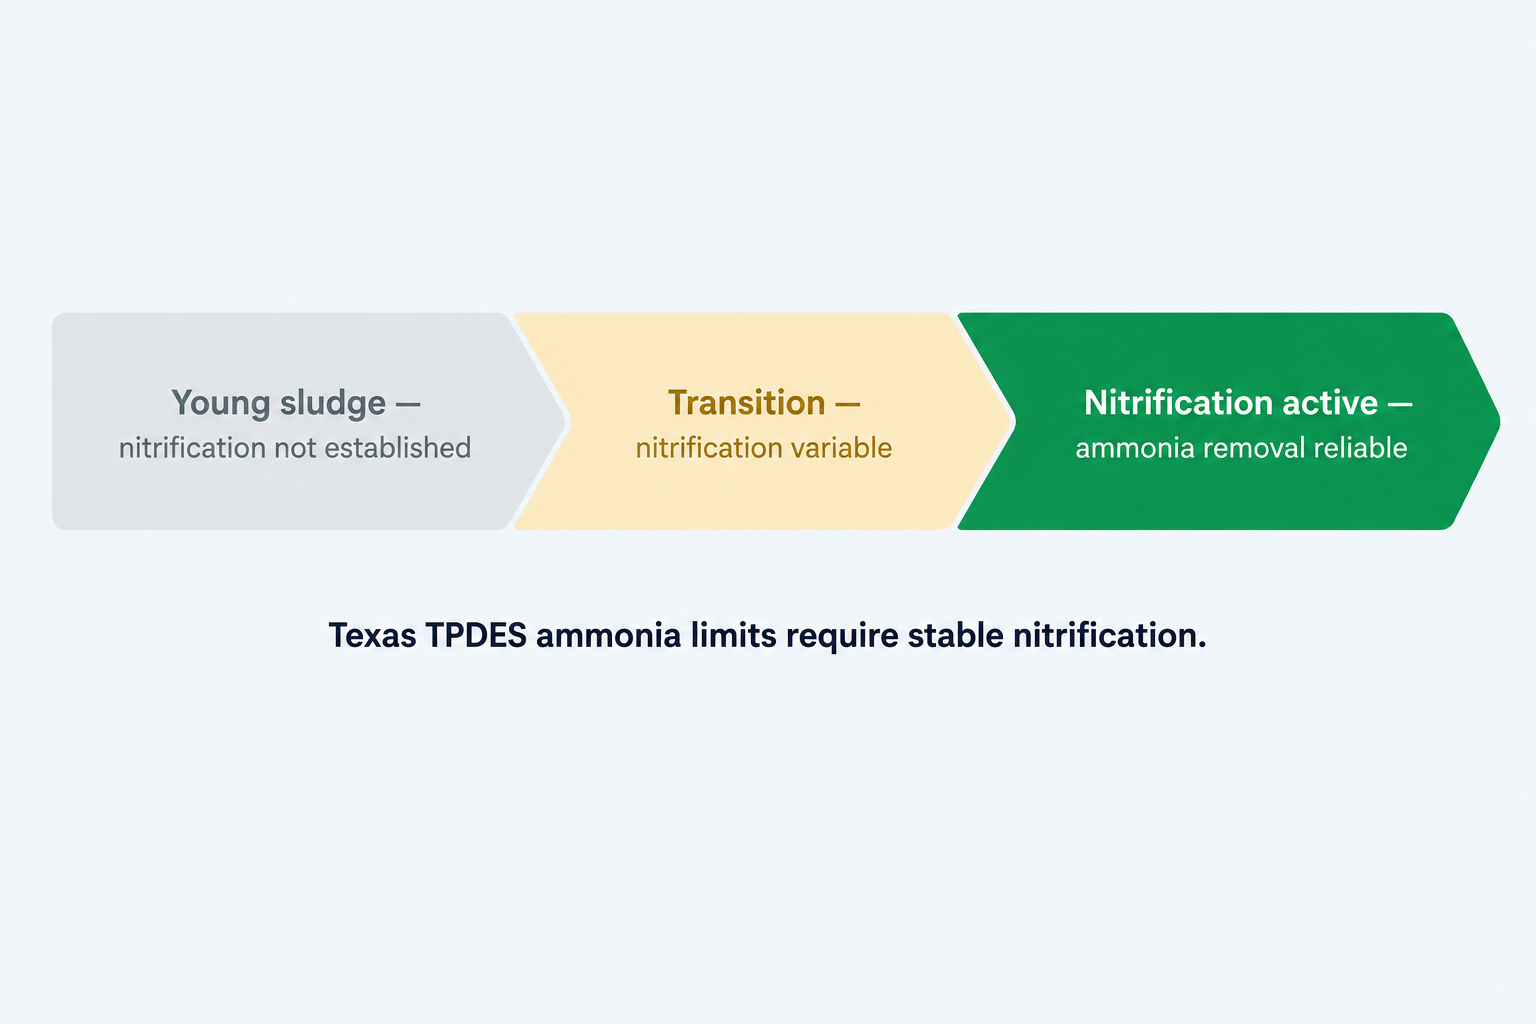
TPDES permits in Texas commonly include effluent ammonia limits. If your plant nitrifies, monitoring SRT alongside ammonia results, DO, temperature, pH, alkalinity, and loading can help identify changes in operating conditions before they affect effluent quality. SRT trends can be a useful indicator, but the timing of any effect on nitrification or effluent quality varies. Review SRT with current ammonia results and other process data rather than assuming a fixed warning period.
F/M ratio and SRT are related but distinct indicators. Under relatively stable conditions, longer SRT may be associated with lower F/M, but changes in loading, wasting, or solids loss can alter either metric independently. Evaluate them together rather than assuming a fixed inverse relationship.
How does SRT relate to your monthly DMR?
SRT does not appear on your DMR. But it is relevant to several parameters that do.
Effluent TSS - SRT affects the biological community and solids inventory in the aeration basin. A low SRT may be associated with young, light sludge that settles less compactly. Settleability measured as SVI can change as SRT shifts. Effluent TSS also depends on loading, aeration, hydraulics, and other factors, so elevated TSS should be evaluated with those in mind.
Effluent ammonia - If SRT falls below the range that supports nitrification at your plant, ammonia removal may become less reliable. TPDES ammonia limits at Texas plants are often tight. Missing a monthly average on ammonia is a permit violation that must be reported to TCEQ.
CBOD removal - Consistent secondary treatment performance requires a biological community maintained by adequate solids retention. Very short SRT can reduce treatment effectiveness over time.
A change in SRT may reflect changes in wasting, solids inventory, or effluent solids losses. Investigate the cause and review the plant's other process indicators before concluding how effluent quality will respond.
Should you still be tracking SRT in a spreadsheet?
A spreadsheet works if every step is followed correctly every day. In practice, keeping the formula, units, and source data consistent across multiple people and shifts is harder than it looks.
Task | Manual spreadsheet | ComplyFlo |
|---|---|---|
Enter MLSS reading | Paper log, then re-enter into spreadsheet | Log once from mobile or tablet |
Calculate SRT | Apply formula manually, verify units and boundary | Calculated when required inputs are available |
Track 30-day trend | Update chart by hand | Auto-generated trend, always current |
Link to DMR data | Separate tab, manual transfer | Parameters feed DMR package directly |
Estimate wasting volume | Separate formula referencing SRT result | Estimate calculated from target SRT with operator review |
Catch formula drift | No built-in check | Formula is fixed, sourced from live readings |
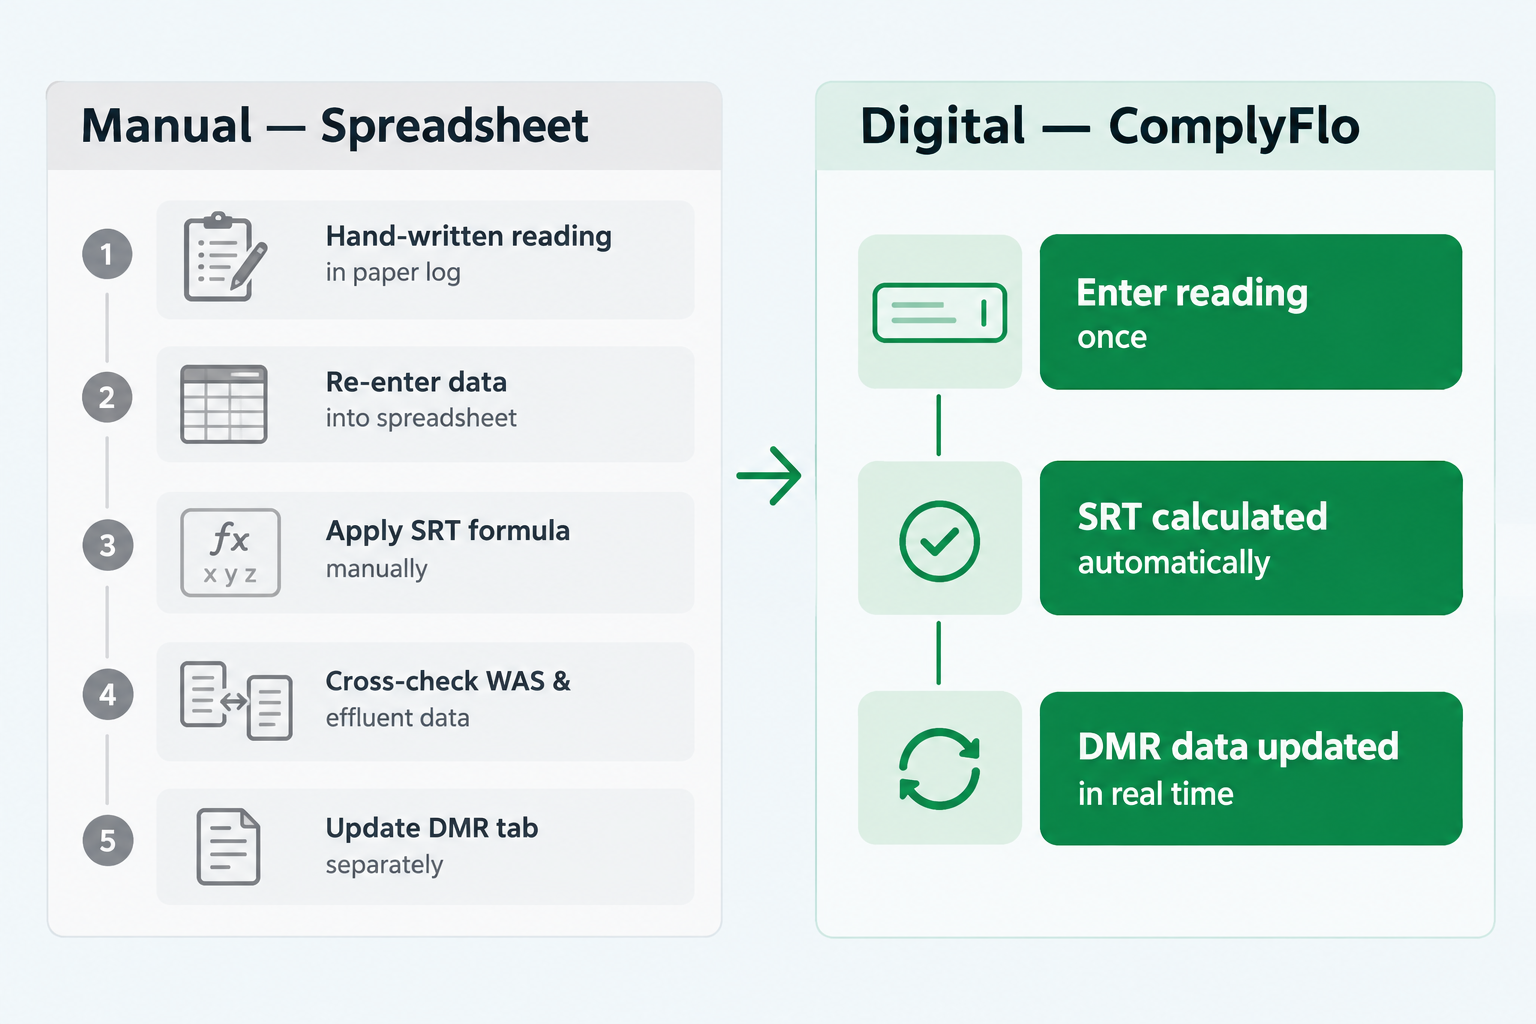
The spreadsheet problem is usually not one dramatic error. It is small inconsistencies that accumulate - a flow entry in the wrong units one day, a formula cell that loses its reference when the sheet is reformatted, or a reading skipped because the operator was handling an SSO event. Each one shifts the SRT calculation slightly. The trend used for wasting decisions becomes less reliable, and nothing flags it.
Try ComplyFlo
ComplyFlo is built for Texas wastewater treatment plants that want to get off spreadsheets without rebuilding their entire operation.
When all required inputs are entered and plant configuration is set up, ComplyFlo calculates and trends SRT alongside your other process parameters - no separate formula, no manual re-entry. Where the required inputs are available, it can also estimate a daily wasting volume corresponding to an operator-selected target SRT. That estimate is a starting point for operator review, not a guaranteed operating instruction, and does not replace the facility's approved process-control procedures. The same readings also feed your monthly DMR package in NetDMR-ready format.
Book a demo at complyflowaste.com to see SRT tracking, process calculators, and TCEQ DMR reporting working together in one platform.
Frequently Asked Questions
What is the formula for solids retention time in wastewater?
A common aeration-basin-based formula is: SRT (days) = (Aeration Basin Volume × MLSS) ÷ (WAS flow × WAS TSS + Effluent flow × Effluent TSS). Use consistent units throughout - volume in MG and flows in MGD, or volume in gallons and flows in gallons per day. The 8.34 conversion factor cancels when both flows are expressed in the same units. Platforms like ComplyFlo can calculate and trend SRT when the required inputs are available.
What SRT is needed for nitrification in wastewater treatment?
There is no single universal minimum. Nitrifying organisms require longer solids retention than carbon-removing organisms, and the required SRT increases as water temperature drops. The appropriate target depends on wastewater temperature, DO, pH and alkalinity, influent characteristics, process configuration, and the facility's design safety margin. Establish the target from the facility's design documents and validated operating history rather than applying a fixed threshold.
How does SRT relate to effluent TSS on my DMR?
SRT affects the mass of solids in your aeration basin and the biological community in your system. A low SRT may be associated with young, poorly-settling sludge and elevated effluent TSS at some plants, but effluent quality also depends on loading, aeration, hydraulics, toxicity, and floc structure. Tracking SRT daily alongside settling observations and effluent results can help catch changes early. Review SRT with your other process indicators, not in isolation.
How often should operators calculate SRT?
Calculate and review SRT at the frequency established by the facility's process-control program. Daily trending is useful where daily wasting and monitoring data are available. Consistent trending against the plant's own baseline - rather than any single reading - is what makes SRT useful for wasting decisions.
What happens if SRT is too high in an activated sludge system?
An SRT above the facility's intended operating range may be associated with low-F/M conditions, increased endogenous respiration, or pin floc at some plants. These outcomes are not universal. Review loading, MLSS/MLVSS, DO, settling observations, effluent quality, and the facility's design objectives before changing wasting. Operating decisions should follow the plant's approved process-control procedures.
Free checklist
TPDES Permit Compliance Checklist
Review permit-specific DMR submissions, sampling, SSO reporting, renewal milestones, and applicable pretreatment responsibilities.
Ready to move your plant logs and reports off paper?
Book a free 1-hour demo with a ComplyFlo team member and see it running on your own workflow.
Book a free demoGet TCEQ compliance updates
Deadline reminders, rule changes, and practical guides for Texas waste operators. No spam — unsubscribe anytime.
By subscribing you agree to receive emails from ComplyFlo. See our privacy policy.