Wastewater
F/M Ratio in Activated Sludge: How to Calculate Food-to-Microorganism Ratio and Use It in Process Control
Learn how to calculate the F/M ratio, what it can indicate about biological loading and solids inventory, and how to trend it alongside SVI, DO, SRT, and effluent performance.
September 23, 2026 · 7 min read

TL;DR
The F/M ratio - food to microorganism ratio - compares incoming organic loading with the volatile solids inventory in an activated-sludge aeration basin. The traditional BOD-based formula is F/M = (Influent Flow x Influent BOD) / (Aeration Volume x MLVSS), expressed as lb BOD/lb MLVSS-day. Many conventional activated-sludge plants operate in a general BOD-based range around 0.2-0.5, while many extended-aeration plants operate at lower ratios. But F/M targets are plant-specific: process design, temperature, treatment objectives, influent characteristics, solids age, and operating history all matter. Trend F/M alongside SVI, DO, SRT, MLSS/MLVSS, settling observations, and effluent results - rather than using any single number as an automatic diagnosis or operating instruction.
Your effluent TSS has been creeping up all week. Your SVI is climbing and you're not sure why. Before you start chasing symptoms - adjusting aeration, checking your clarifier, wondering about an industrial discharge event upstream - there's one number worth calculating first.
The F/M ratio activated sludge calculation is a useful starting point. It gives you a snapshot of the relationship between organic loading and the biomass in your basin. ComplyFlo tracks F/M automatically from the BOD and MLVSS readings you're already entering - alongside SVI, SRT, DO, and HRT on a single dashboard - so teams can review trends in context and follow their approved operating procedures. The rest of this post covers what F/M is, how to calculate it by hand, and how to interpret what you're seeing.
What is the F/M ratio?
The F/M ratio is a process-control metric that compares the organic load (food) entering your aeration basin with the volatile solids inventory (microorganisms) available to consume it. It is not a permit limit, and it does not appear on your DMR.
Three things F/M can tell you:
F/M reflects loading conditions and biomass age. A higher F/M generally indicates higher loading relative to biomass, which tends toward younger sludge. A lower F/M indicates lower loading relative to biomass, which tends toward older sludge. Both directions affect biological activity, oxygen demand, settleability, and effluent quality - though the relationships depend on plant-specific conditions. The EPA Wastewater Technology Fact Sheet on Activated Sludge identifies F/M as one of the primary operational parameters for process characterization in biological treatment systems.
F/M is one input into a broader picture. Effluent quality depends on influent characteristics, treatment design, DO, clarifier performance, hydraulics, equipment condition, solids inventory, temperature, and other factors. F/M trending is most useful when read alongside SVI, SRT, MLSS/MLVSS, DO, loading, and effluent results.
F/M changes before effluent results do. Because it reflects current loading and biomass conditions, a shift in F/M can be visible before that shift shows up in effluent data. That lag time is why consistent trending has value as an early data point for investigation.
What is the F/M ratio formula, and how do you convert the units?
The formula is straightforward. The unit conversion is where most hand calculations go wrong, so here it is step by step.
F/M = (Influent Flow x Influent BOD) / (Aeration Volume x MLVSS)
Each variable is defined as follows:
Influent Flow - average influent flow for the period used in the calculation, in million gallons per day (MGD), consistent with the facility's process-control method
Influent BOD - BOD₅ entering the aeration basin for the same period, in milligrams per liter (mg/L)
Aeration Volume - active aeration volume, in million gallons (MG)
MLVSS - volatile suspended solids in the mixed liquor for the same period, in mg/L
Unit conversion, step by step
Write the formula in units: (MGD x mg/L) / (MG x mg/L)
Convert flow to a mass rate: Multiplying MGD x mg/L by 8.34 gives lb BOD/day in the numerator.
Convert basin content to mass: Multiplying MG x mg/L by 8.34 gives lb MLVSS in the denominator.
The 8.34 cancels. It appears identically in both numerator and denominator. You do not need to multiply it through.
Result: lb BOD/day / lb MLVSS = lb BOD / lb MLVSS-day
Worked example
A plant is running the following conditions:
Influent Flow: 1.5 MGD
Influent BOD: 200 mg/L
Aeration Volume: 0.5 MG
MLVSS: 2,000 mg/L
F/M = (1.5 x 200) / (0.5 x 2,000) = 300 / 1,000 = 0.30 lb BOD/lb MLVSS-day
That result falls within a range commonly associated with conventional activated-sludge systems. Whether it is appropriate for a specific plant depends on that plant's design, permit, influent characteristics, and operating history.
A note on MLVSS vs. MLSS. MLVSS is the preferred denominator because it more closely represents the volatile fraction of biomass in the traditional F/M calculation. The inorganic fraction of MLSS - grit, sand, non-volatile solids - does not consume BOD, so using MLSS inflates the denominator and produces a lower apparent F/M. If a current MLVSS result is not available, some facilities use a historical plant-specific MLVSS-to-MLSS fraction for screening calculations. Do not assume a fixed ratio is correct for every facility; establish it from your own laboratory history and follow the facility's process-control procedures.
What does your F/M number mean?
F/M places your current loading-to-biomass relationship in a general context. The table below reflects commonly cited BOD-based reference ranges. They are general planning ranges, not universal operating limits - the appropriate range for any plant depends on process configuration, temperature, influent characteristics, treatment goals, and whether the calculation uses BOD or COD.
F/M range | General interpretation | What to evaluate |
|---|---|---|
Below roughly 0.05 | Low loading / high biomass condition | Compare with plant history, SRT, MLSS/MLVSS, loading trend, settling observations, pin floc, denitrification, and effluent quality |
Roughly 0.05-0.15 | Common range for many extended-aeration systems | Confirm against design basis, temperature, nitrification objectives, and historical performance |
Roughly 0.2-0.5 | Common range for many conventional activated-sludge systems using BOD-based F/M | Confirm against design basis, load, DO, SRT, settling performance, and effluent results |
Above roughly 0.5 | Higher loading / lower biomass condition | Review influent loading, solids inventory, SRT, oxygen-transfer capacity, settleability, and potential process upset |
These ranges reflect general BOD-based heuristics. Compare any F/M result against your plant's own baseline and approved process-control targets - not just a reference table.
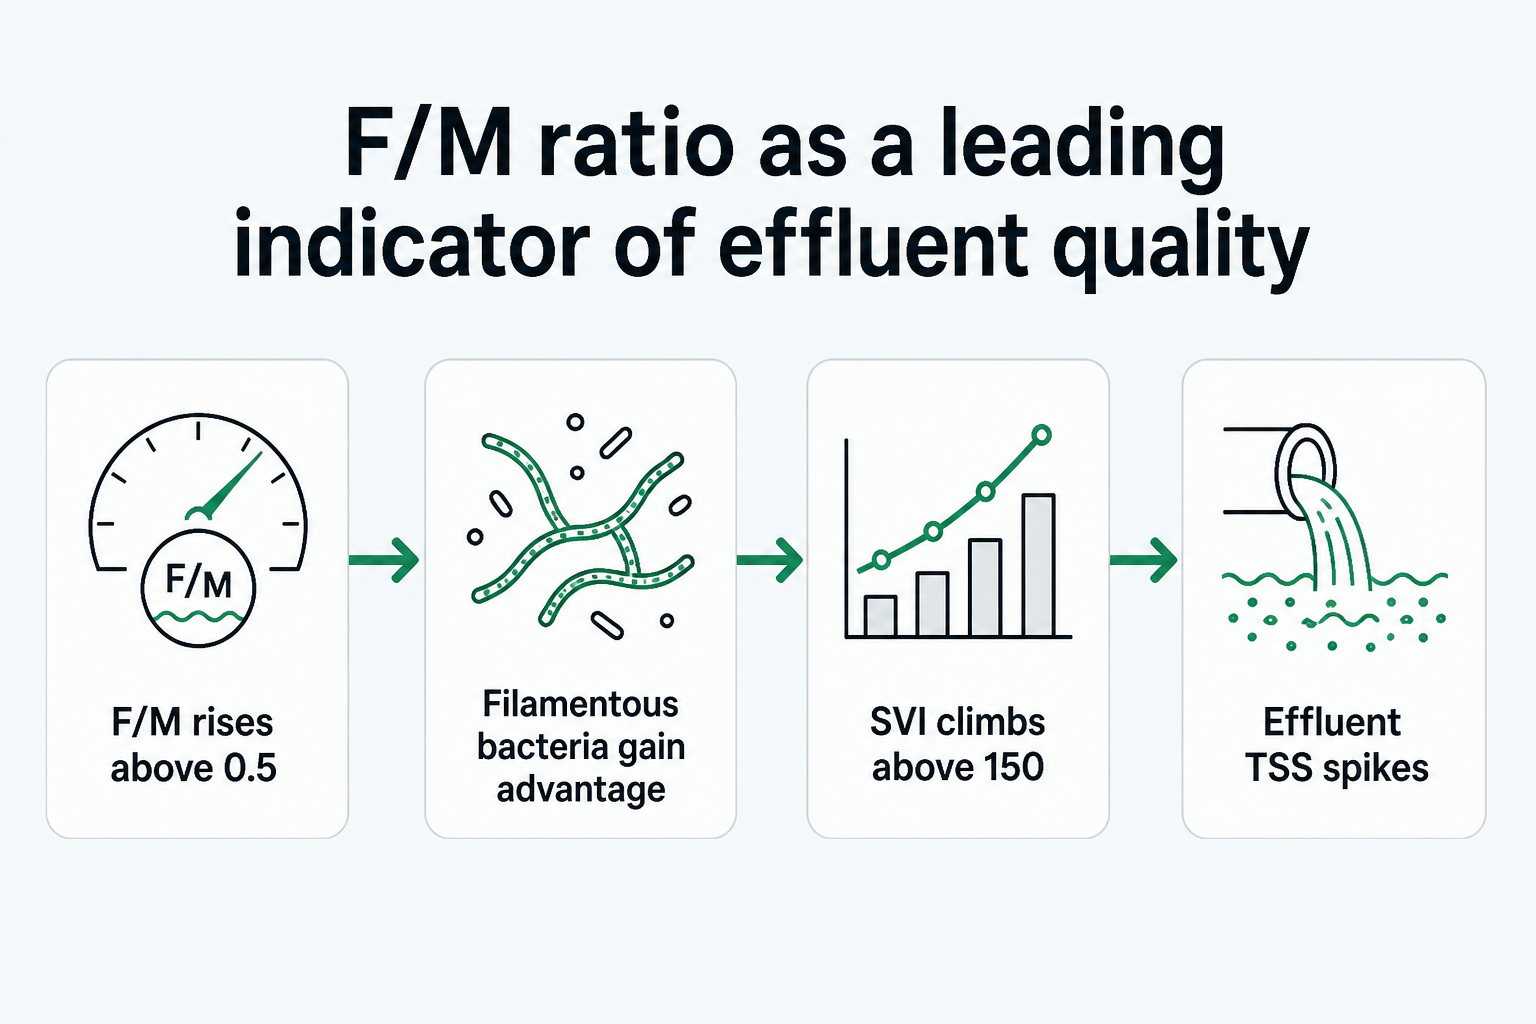
F/M can influence conditions that affect settleability, but the relationship is not a simple causal chain. Different filamentous organisms are associated with different conditions - including low DO, low or high loading depending on organism type, nutrient imbalance, septic influent, sulfides, FOG, selector performance, and changes in solids age. Use microscopy, settleometer data, and plant-specific trend information before assigning a cause to any settling problem. Our guide to calculating SVI covers how to track and interpret settleability alongside F/M.
How does F/M relate to your monthly DMR?
F/M is not normally reported as a DMR parameter. It is an internal process-control metric.
Effluent CBOD and TSS appear on DMRs where they are permit limits. Whether a plant meets those limits depends on many factors: influent characteristics, treatment design, clarifier performance, DO, hydraulic conditions, equipment condition, solids management, weather, and plant-specific operations. F/M is one useful data point in understanding loading and biomass conditions, but it is not a stand-alone indicator of permit performance.
Tracking F/M consistently - as part of a broader set of process-control records including SVI, DO, SRT, MLSS/MLVSS, settling observations, and effluent data - gives operations staff more information to work with when investigating performance changes or responding to regulator questions about process management.
How does F/M ratio connect to SVI, SRT, and DO?
F/M does not operate in isolation. Three other process indicators are worth reviewing alongside it.
SVI - Settleability can be affected by loading conditions and solids age, and F/M is one way to characterize both. However, settleability problems can stem from a wide range of causes including DO, influent characteristics, nutrient conditions, toxic inputs, and selector performance. SVI calculation and interpretation covers how to track and evaluate settleability as a separate metric.
SRT - F/M and solids retention time are related process-control indicators, but they are calculated differently and should be evaluated together rather than assumed to move in exact opposite directions. A change in influent load, solids inventory, wasting, or solids loss can affect one or both metrics.
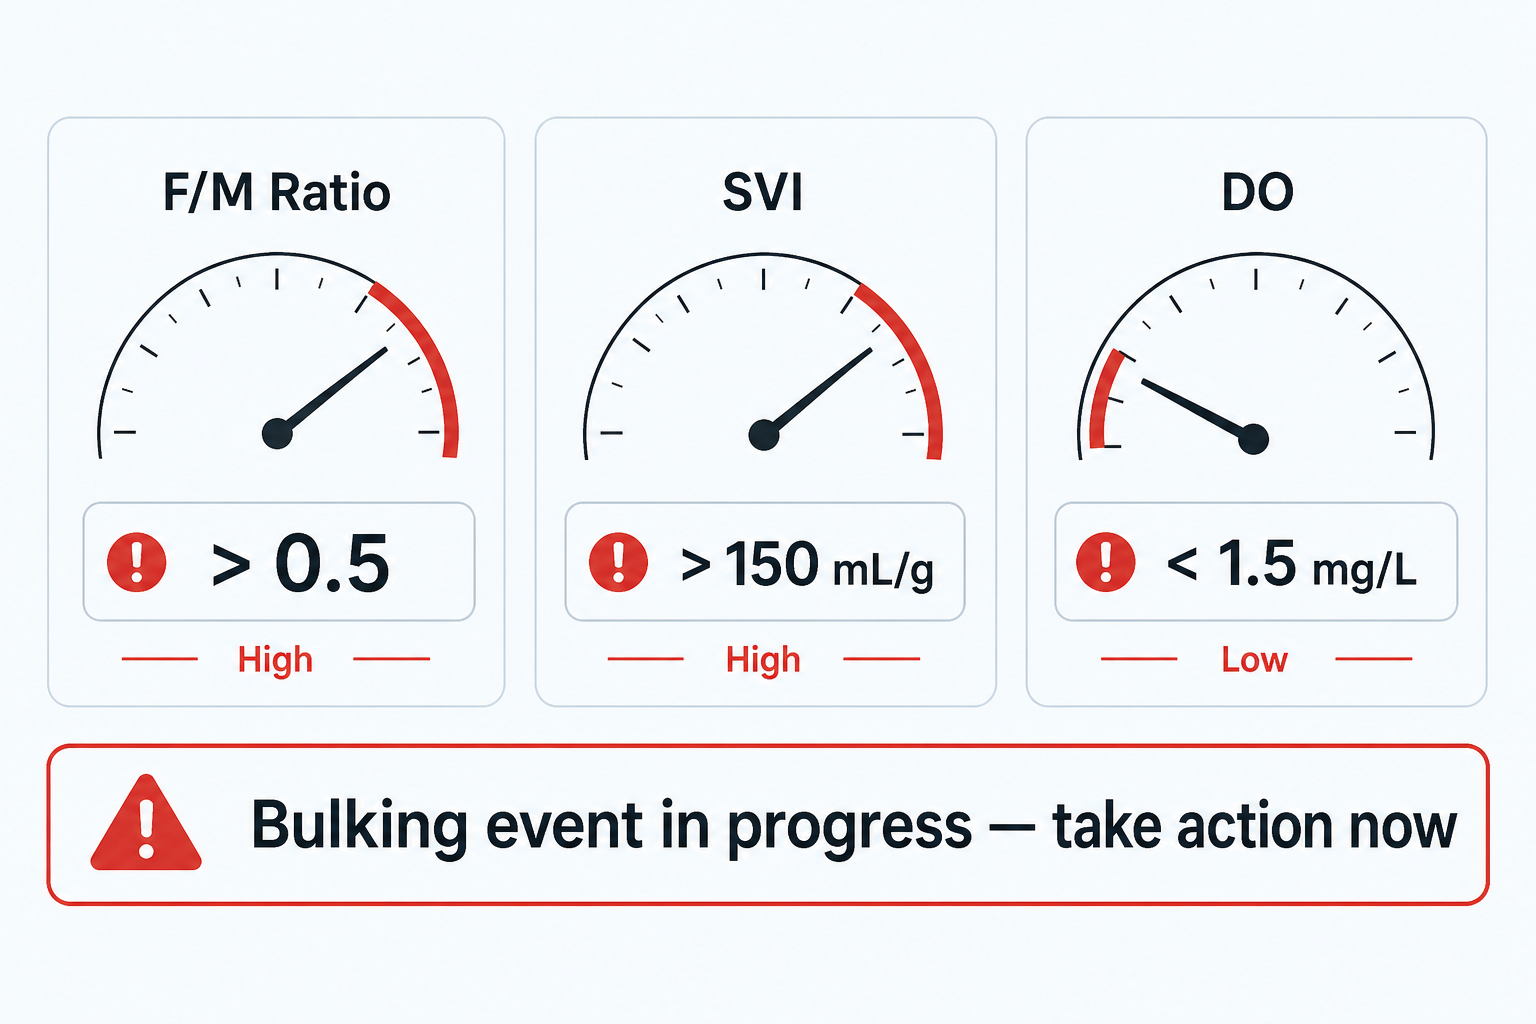
DO - Higher F/M loading conditions generally increase oxygen demand. If aeration capacity is insufficient to meet that demand, DO may fall - and low DO can affect both biological performance and settleability. Review aeration capacity and DO data as part of any process-control assessment.
A rising F/M trend, declining DO, worsening settleability, and increasing SVI can be a concerning pattern that warrants prompt investigation. Confirm the test data, inspect the clarifier and settleometer, review loading and solids inventory, and use microscopy where available before selecting a corrective action.
What should you do when F/M is outside your plant's normal range?
An F/M value outside the plant's expected operating range should trigger investigation - not an automatic wasting adjustment. First confirm the calculation inputs and compare the current reading with recent trends in influent loading, flow, MLSS/MLVSS, wasting, SRT, DO, settling, and effluent quality.
If F/M is high: Determine whether the driver is increased organic loading, reduced biomass inventory, solids loss, a recent wasting change, a change in basin volume, or another upset. Review oxygen-transfer capacity and clarifier performance as part of the assessment.
If F/M is low: Determine whether the driver is reduced influent loading, excessive biomass inventory, extended solids age, a process-design condition, or seasonal/operational change. Review the facility's process-control targets and downstream settling performance.
Any adjustment to wasting, aeration, return activated sludge, chemical use, or flow management should follow the facility's approved SOPs and be made by qualified personnel based on the identified root cause. Changes to wasting affect SRT, MLSS, nitrification performance, clarifier loading, and solids handling - a plant-specific evaluation is necessary before making any adjustment.
Document every investigation and any actions taken. Good records of what you observed, what you checked, and what you changed are the foundation of sound process management and a clear record if questions arise during regulatory review.
Try ComplyFlo
Consistent F/M trending can help activated-sludge teams see changes in loading and biomass conditions sooner. ComplyFlo keeps F/M, SVI, DO, SRT, HRT, and related process-control readings together so teams can review trends in context, spot changes early, and follow their approved operating procedures without managing multiple spreadsheets or manual calculation steps.
Book a demo to see how ComplyFlo works for your plant.
Frequently Asked Questions
What is the F/M ratio in wastewater treatment?
The F/M ratio (food-to-microorganism ratio) compares incoming organic loading with the volatile solids inventory in an activated-sludge aeration basin. It is calculated as: F/M = (Influent Flow x Influent BOD) / (Aeration Volume x MLVSS), with the result in lb BOD per lb MLVSS per day. F/M is a process-control metric - not a permit limit or DMR parameter. <a href="https://complyflowaste.com/wastewater">ComplyFlo tracks F/M automatically</a> alongside SVI, SRT, DO, and HRT so teams can review trends in context.
What is a normal F/M ratio for activated sludge?
F/M targets are plant-specific and depend on process configuration, temperature, treatment objectives, and influent characteristics. As a general BOD-based planning reference: many conventional activated-sludge plants operate around 0.2-0.5 lb BOD/lb MLVSS-day; many extended-aeration plants operate in a lower range, roughly 0.05-0.15. These are general ranges, not universal setpoints. Compare your result against your own plant history and approved process-control procedures, not just a reference table.
How do I calculate the F/M ratio at my plant?
Use the formula: F/M = (Influent Flow in MGD x Influent BOD in mg/L) / (Aeration Volume in MG x MLVSS in mg/L). When flow is in MGD, volume in MG, and concentrations in mg/L, the 8.34 unit conversion factor appears in both numerator and denominator and cancels, giving a result in lb BOD/lb MLVSS-day. Example: 1.5 MGD x 200 mg/L / (0.5 MG x 2,000 mg/L) = 0.30 lb BOD/lb MLVSS-day. Use MLVSS when available; if not, use a plant-specific MLVSS-to-MLSS ratio from your own laboratory history rather than a generic estimate.
Does the F/M ratio appear on my monthly DMR?
No - F/M is a process-control parameter, not a reported effluent limit. Effluent CBOD and TSS appear on DMRs where they are permit limits; their performance depends on many factors including influent characteristics, treatment design, clarifier performance, DO, hydraulics, equipment condition, and plant-specific operations. F/M is one useful data point for understanding loading and biomass conditions. Track it alongside other process indicators and your facility's approved operating procedures.
What should I do when F/M is outside my plant's normal range?
An F/M value outside the plant's expected range should trigger investigation, not an automatic adjustment. First confirm the calculation inputs and compare the result with recent trends in influent loading, flow, MLSS/MLVSS, wasting, SRT, DO, settling, and effluent quality. If F/M is high, determine whether the driver is increased organic loading, reduced biomass, solids loss, or another upset. If F/M is low, determine whether the driver is reduced loading, excessive biomass, extended solids age, or a seasonal/operational change. Any adjustment to wasting, aeration, RAS, or flow should follow the facility's approved SOPs and be made by qualified personnel based on the identified root cause.
See ComplyFlo in action
Manifests, compliance reporting, and billing in one platform built for waste operations.
Book a demo