Wastewater
Sludge Volume Index Formula: How to Calculate SVI and What Your Number Is Telling You
The SVI formula is SVI = SV30 × 1000 ÷ MLSS. Learn what your number means, how often to track it, and what to do when it climbs.
September 22, 2026 · 7 min read
---
TL;DR
SVI tells you how well your activated sludge is settling. The formula: SVI = SV30 × 1,000 ÷ MLSS. Many conventional activated-sludge plants operate well in the roughly 80-150 mL/g range. An SVI above roughly 150 mL/g is commonly treated as a bulking or reduced-settleability warning, and above roughly 250 mL/g is a severe concern at many plants - but every facility has its own normal range and baseline. Compare today's reading with your plant's own trend, not just a universal number. For activated-sludge plants, regular SVI trending is a practical early-warning tool for deteriorating settleability before it shows up in effluent TSS. If you'd rather skip the manual math, ComplyFlo calculates SVI automatically and shows your 30-day trend alongside DO, F/M, and MLSS in one dashboard.
You just pulled your 30-minute settleometer reading. The sludge settled to 250 mL. You wrote it down. Now what?
That number alone doesn't tell you much. The sludge volume index formula turns it into a process control metric you can actually act on. For activated-sludge plants, it answers one of the most important regular process-control questions an operator tracks: is my sludge settling the way it should?
What is sludge volume index, and why does it matter?
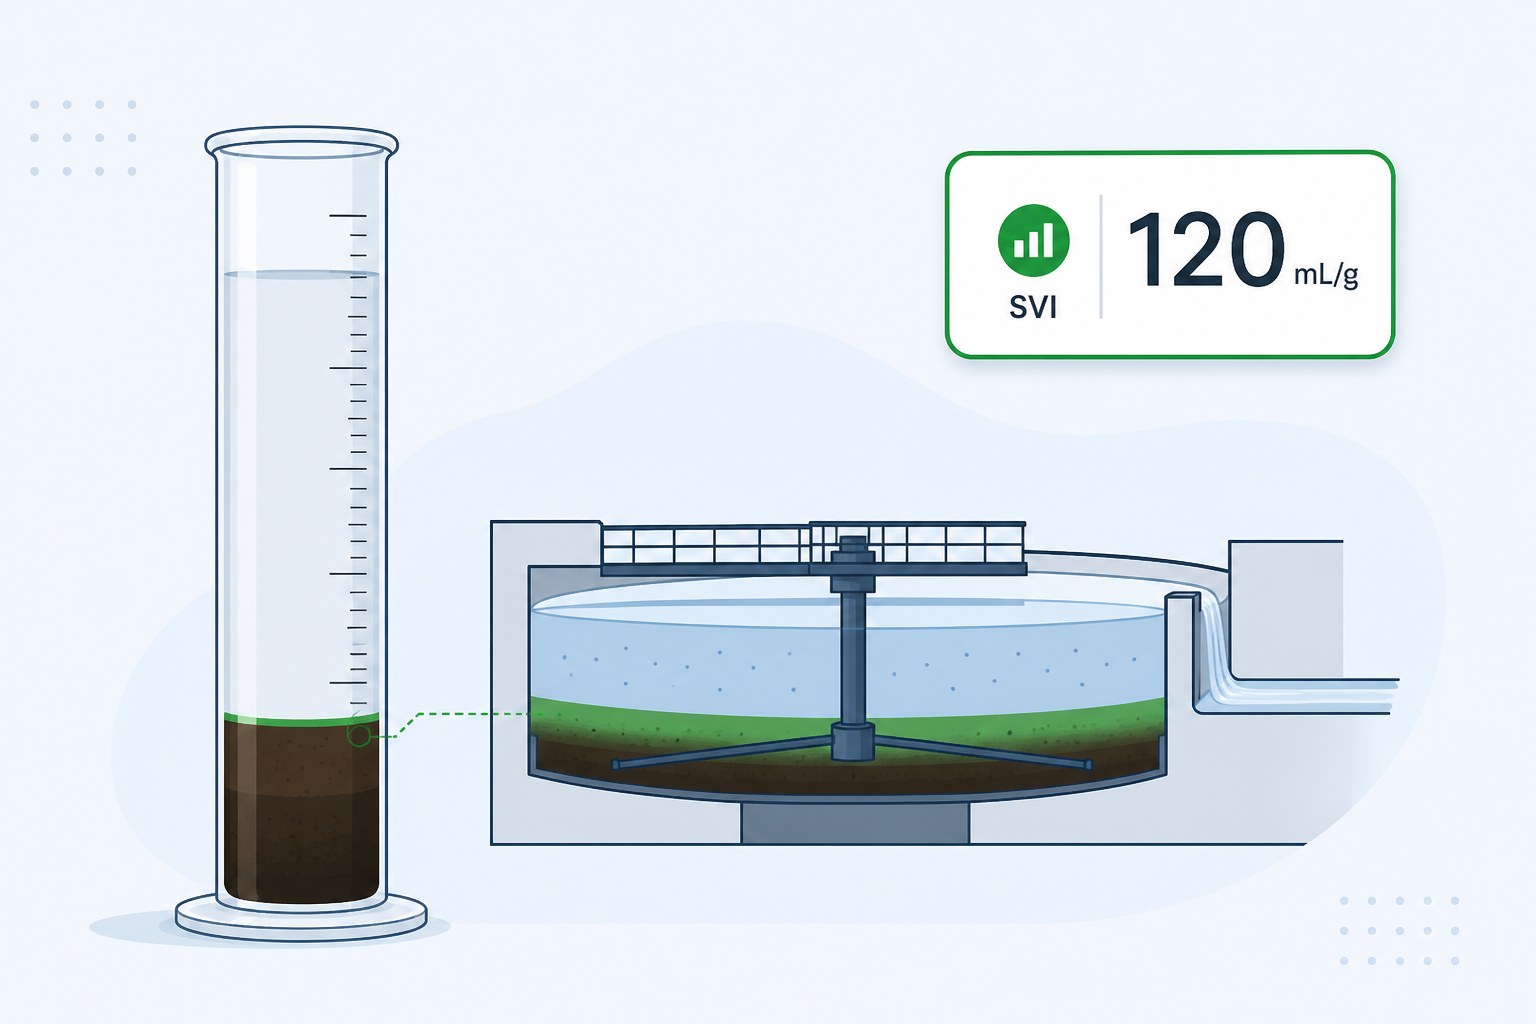
SVI is a measure of how well activated sludge settles and compacts in the clarifier. It expresses the volume that one gram of dry sludge solids occupies after 30 minutes of settling - in milliliters per gram. Lower SVI values generally reflect more compact settled sludge, while higher values can indicate less compact, more slowly settling sludge. Interpretation should always be tied to the facility's historical performance, settling appearance, blanket behavior, and effluent quality. Poor settling leads directly to solids carryover into the effluent. Solids carryover is the direct path from a high SVI to an effluent TSS permit violation.
SVI is not a measure of organism health. It does not tell you which filament is growing or whether your nitrifiers are stressed. It is a downstream indicator - a signal that something upstream has already changed. The EPA activated sludge reference treats SVI as a primary settling performance metric and describes bulking sludge as generally having SVI above 150 mL/g, while noting that plant-specific conditions vary.
What is the SVI formula and how do you calculate it?
The sludge volume index formula is:
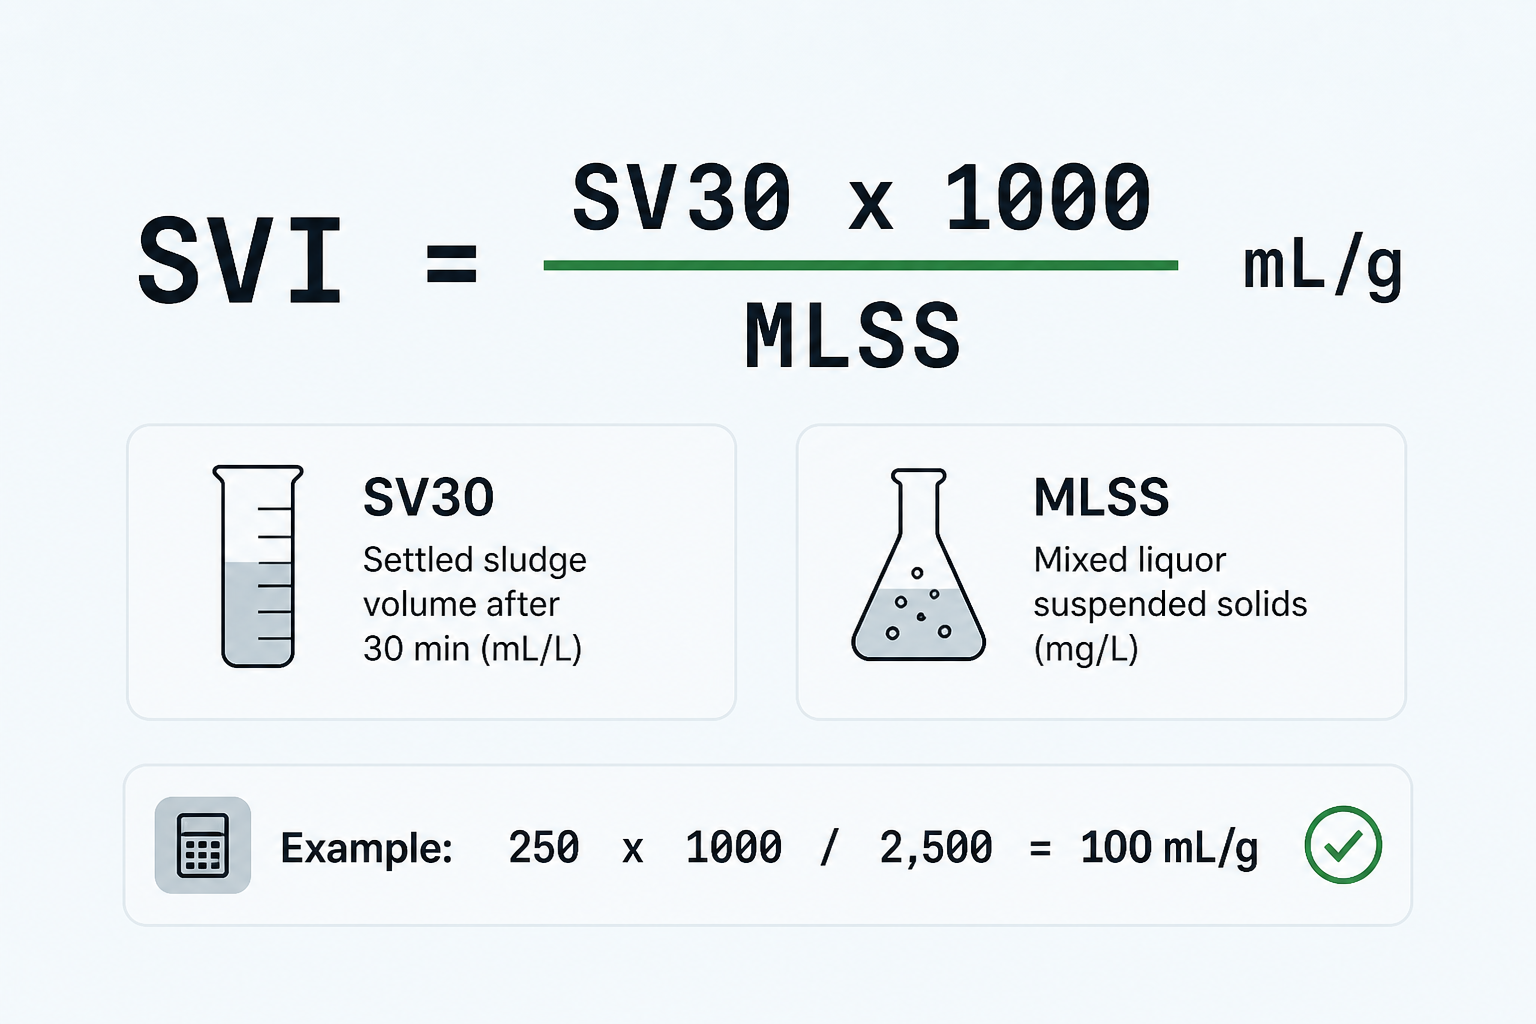
SVI (mL/g) = SV30 (mL/L) × 1,000 ÷ MLSS (mg/L)
Here is what each variable means:
SV30 - the volume your sludge settles to in a 1-liter settleometer after exactly 30 minutes, in mL. If the sludge settles to 250 mL after 30 minutes, your SV30 is 250 mL/L.
MLSS - mixed liquor suspended solids, the total concentration of suspended solids in your aeration basin, in mg/L. This comes from your daily lab analysis of the aeration basin sample.
Worked example:
SV30 = 250 mL/L
MLSS = 2,500 mg/L
SVI = 250 × 1,000 ÷ 2,500 = 100 mL/g
A result of 100 mL/g falls in the middle of the normal range.
Two common mistakes to avoid:
Do not substitute a 60-minute settle reading for SV30. SVI is conventionally calculated from the settled sludge volume after exactly 30 minutes. A 60-minute reading may show additional compaction, but it is not directly comparable with standard SVI benchmarks or your facility's own SV30 trend.
Getting the units wrong. SV30 must be in mL/L and MLSS must be in mg/L. The ×1,000 factor exists to make the units work out to mL/g. If you use different units, your SVI will be off by a factor of 1,000.
When operators enter SV30 and MLSS readings in the expected units, ComplyFlo's wastewater plant platform calculates SVI automatically - no spreadsheet, no formula to remember. It also tracks a rolling 30-day trend so you can spot changes in settleability over time. ComplyFlo is a data-tracking and workflow tool. It does not replace the judgment of a licensed operator, the facility's approved operating procedures, permit requirements, or qualified process-control support.
What does your SVI number actually mean?
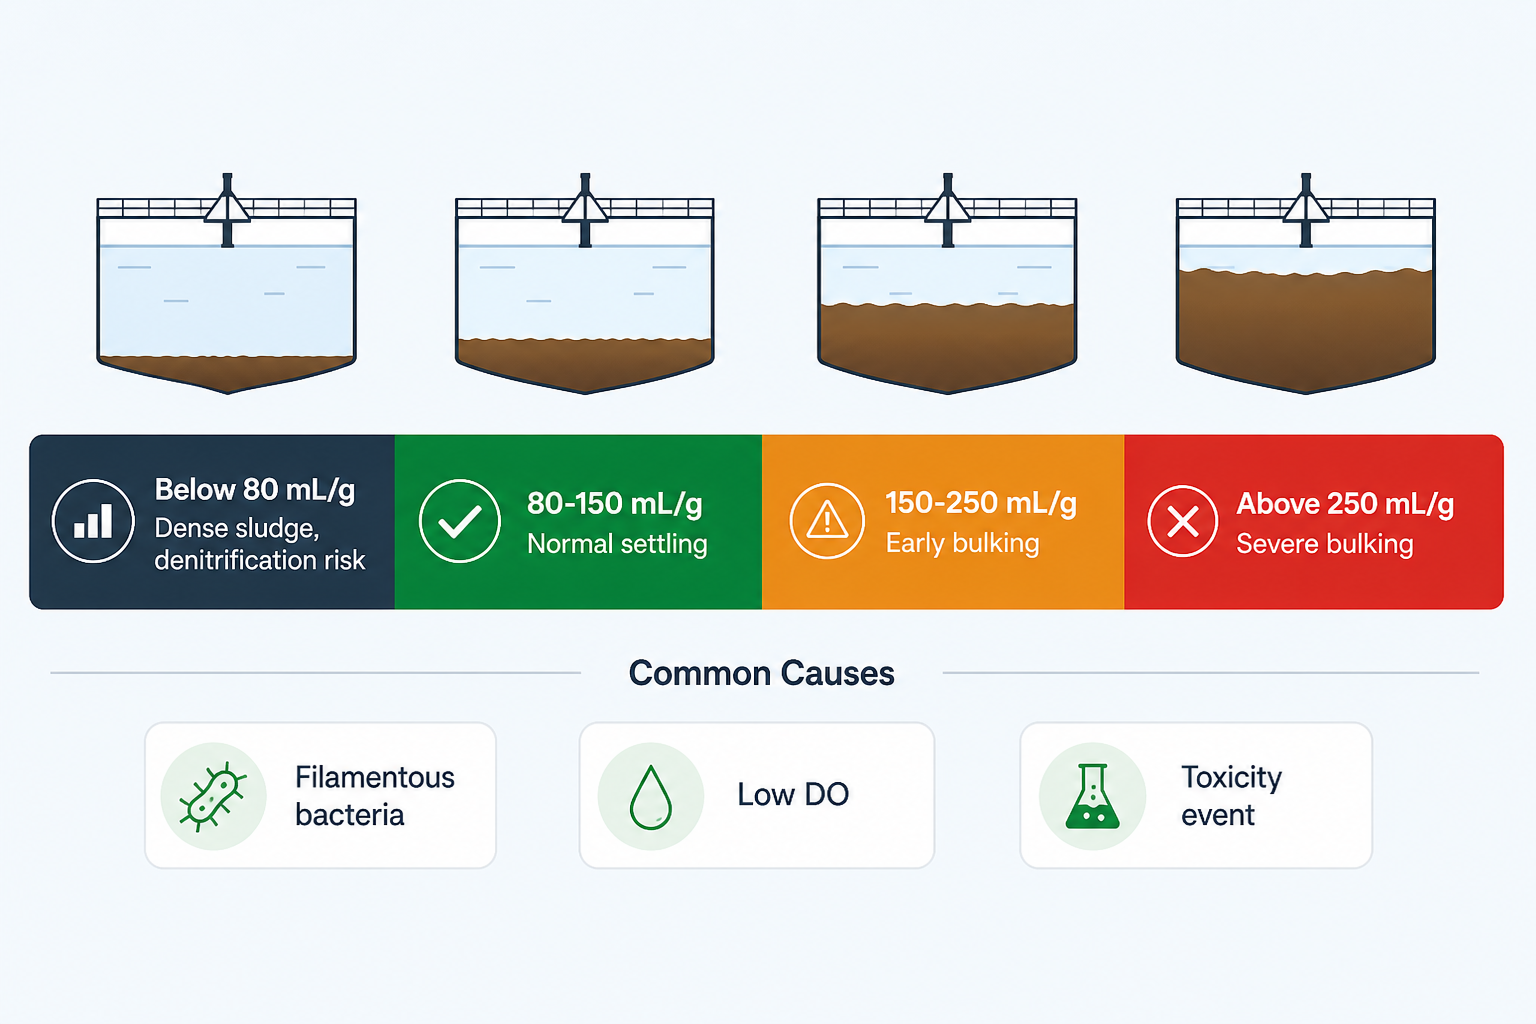
Your SVI result is most useful as a trend against your own plant's baseline. The table below shows general interpretation ranges used in many conventional activated-sludge systems. Establish your plant-specific operating baseline and use that as your primary reference.
General interpretation ranges - compare with your plant's own baseline, not just these numbers.
SVI Range | General interpretation | What to evaluate |
|---|---|---|
Below roughly 80 mL/g | Dense, compact sludge - may be normal for some plants | Compare with baseline; watch for pin floc, poor solids capture, denitrification, and blanket behavior |
Roughly 80-150 mL/g | Common operating range for many conventional plants | Maintain plant-specific targets and trend performance |
Above roughly 150 mL/g | Bulking tendency or reduced settleability may be developing | Review settling appearance, microscopy, DO, loading, SRT, nutrients, and clarifier performance |
Above roughly 250 mL/g | Severe settleability concern at many plants | Escalate review; verify blanket, effluent TSS, hydraulic loading, and root cause |
What each range may indicate:
Below roughly 80 mL/g - compact, dense sludge. A low SVI often means the sludge is compact and dense. That can be acceptable at some plants. A sudden decline from the plant's normal baseline can accompany pin floc, poor solids capture, denitrification, or a change in solids age. Review sludge blanket condition, effluent quality, settling appearance, and wasting rate against your plant's historical baseline before making operational changes.
Roughly 80-150 mL/g - common operating range. Many conventional activated-sludge plants operate well in this range. The goal is to maintain the conditions that got you here and track against your plant's own trend.
Above roughly 150 mL/g - reduced settleability developing. Filamentous bacteria growth is a common cause of elevated SVI, but other factors can also reduce settleability - loading changes, solids age, nutrient imbalance, septic influent, or toxicity events. This is the window to investigate using microscopy and process trend review.
Above roughly 250 mL/g - severe settleability concern. At many plants this range places the clarifier at elevated risk. Effluent TSS may already be affected. Follow the facility's approved procedures and escalate as needed.
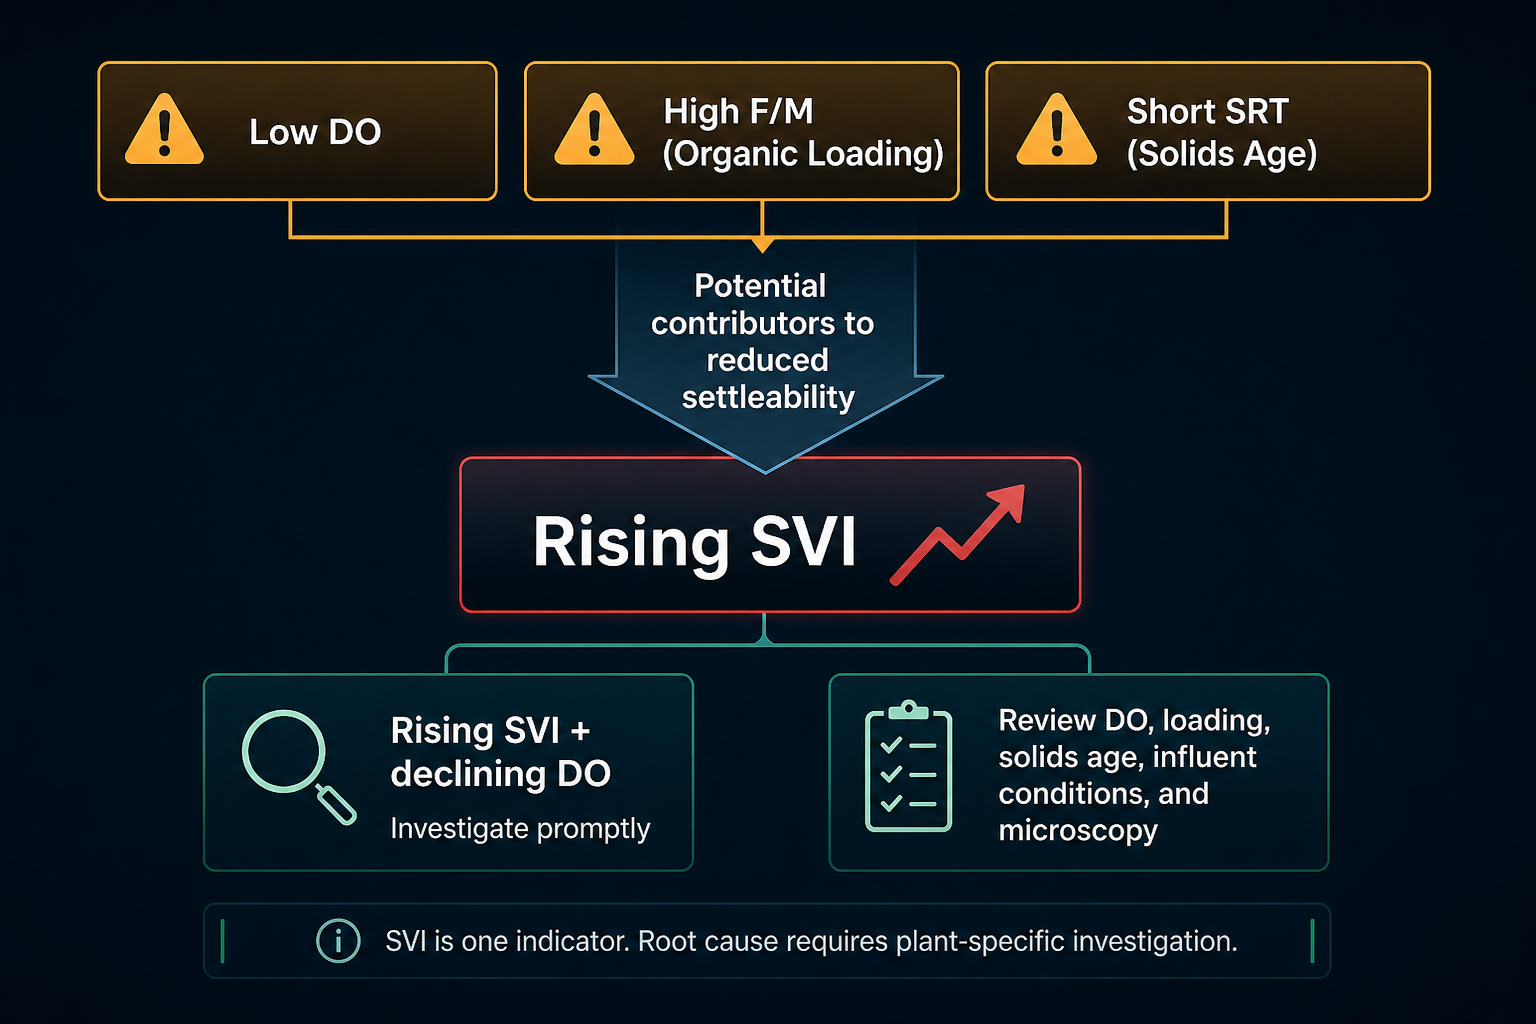
SVI tells you that something may need attention. It does not tell you why. Microscopy and a review of recent process conditions - DO, loading, SRT, influent characteristics, and plant history - are the tools for identifying the cause.
How often should you calculate SVI?
For many activated-sludge facilities, regular SVI monitoring is a useful way to identify changing settleability before clarifier performance deteriorates. The Water Environment Federation lists daily process control measurements as a standard practice for activated-sludge systems. The appropriate testing frequency should follow the facility's design, operating procedures, permit requirements, and process-control needs.
Settleability can change quickly during a toxicity event, hydraulic load spike, or sudden change in influent characteristics. Testing every few days may leave a significant gap between when a problem starts and when it's detected. A pattern like a climbing SVI from one reading to the next is often more useful than any single data point.
SVI does not appear directly on a monthly DMR. But clarifier performance shows up in effluent TSS. For activated-sludge plants, routine SVI trending can be a practical early-warning tool for deteriorating settleability and potential solids-loss risk before it affects permit parameters.
How does SVI relate to your other process parameters?
SVI does not change in isolation. Several process parameters can influence settleability.
F/M ratio. F/M can influence settleability, but it should not be used as a stand-alone diagnosis. Different filamentous organisms are associated with different conditions - low dissolved oxygen, nutrient imbalance, septic or sulfide-bearing influent, FOG-related conditions, selector performance, and changes in loading or solids age. Use microscopy and plant-specific trend data to identify the likely cause before changing operations.
DO. Inadequate aeration and low dissolved oxygen in the aeration basin can contribute to some forms of filamentous bulking. Maintaining the plant's target DO range is one of the most basic and effective process-control steps available. Confirm the plant's design DO target and operating permit requirements rather than applying a single universal threshold.
SRT. A change in solids retention time can affect floc development and settling. The appropriate SRT is process- and temperature-specific - it varies significantly between conventional activated sludge, extended aeration, nitrifying systems, and other configurations. Compare SRT with the plant's design basis, operating permit requirements, nitrification goals, historical performance, and current loading before changing wasting rates.
The pattern to watch: SVI trending up while DO is dropping. That combination is an important warning signal - it may be consistent with filamentous growth or inadequate oxygen transfer, but operators should confirm the cause through microscopy, loading review, settling observations, and plant-specific trend data before acting.
What should you do when SVI is high?
A high or rapidly rising SVI should trigger investigation - not an automatic one-size-fits-all adjustment. Follow the facility's approved operating procedures and involve the responsible operator, supervisor, consultant, or process-control specialist as appropriate. The steps below are an investigation checklist, not a prescription.
When SVI rises above the plant's normal baseline:
Confirm the test. Verify settle time, sample location, cylinder volume, MLSS result, and units before drawing conclusions from a single reading.
Inspect the settling test and clarifier. Note floc appearance, pin floc, floating or rising sludge, blanket condition, scum, and effluent clarity.
Review recent process trends. Look at DO, influent flow and loading, MLSS and MLVSS, wasting rate, RAS and WAS flow, SRT, pH, temperature, nutrient balance, and any recent industrial user or shock-load events.
Check effluent quality. Review effluent TSS, turbidity, and any other relevant permit or process-control parameters.
Use microscopy where available. Microscopy can help distinguish filamentous bulking from pin floc, dispersed growth, viscous bulking, or other settling and flocculation problems. The organism identification guides the appropriate corrective direction.
Document observations and decisions. Record readings, trend information, process observations, corrective steps taken, and follow-up results in the facility's operating records. Good documentation supports both internal process-control decisions and any regulatory review.
Make operational changes only under the approved process-control plan. Adjustments to aeration, wasting, RAS, chemical treatment, or flow management should be specific to the facility, based on identified root cause, and made by qualified personnel under the plant's approved operating strategy.
Contact your supervisor, plant engineer, state-certified operator, or process-control consultant before making significant operational changes - especially at higher SVI values where clarifier performance may already be affected.
Try ComplyFlo for automatic SVI tracking
SVI can be a useful early-warning indicator for activated-sludge plants. Consistent trending helps operators recognize changes in settleability sooner, investigate the underlying cause, and respond under the facility's approved operating procedures before clarifier performance affects effluent quality.
ComplyFlo calculates SVI from entered SV30 and MLSS readings and displays the trend alongside DO, F/M, and MLSS, helping teams keep related process-control information in one place - no spreadsheet, no manual formula.

Book a demo at complyflowaste.com to see SVI tracking, process calculators, and TCEQ DMR reporting working together in one platform.
Frequently Asked Questions
What is the sludge volume index formula?
SVI (mL/g) = SV30 (mL/L) × 1,000 ÷ MLSS (mg/L). SV30 is the volume your activated sludge settles to in a 1-liter settleometer after exactly 30 minutes. MLSS is the mixed liquor suspended solids concentration in your aeration basin. Tools like <a href="https://complyflowaste.com/wastewater">ComplyFlo</a> calculate SVI automatically each time you enter a SV30 and MLSS reading.
What is a normal SVI range for activated sludge?
Many conventional activated-sludge plants operate well in the roughly 80-150 mL/g range, and an SVI above roughly 150 mL/g is commonly treated as a bulking or reduced-settleability warning. But every plant has its own normal range. Interpreting SVI against the plant's own historical baseline is more useful than comparing with a single universal threshold. The <a href="https://www.epa.gov/sites/default/files/2015-06/documents/completesmall_0.pdf">EPA activated sludge reference</a> describes bulking sludge as generally having SVI above 150 mL/g, while noting that plant-specific conditions vary.
How often should I calculate SVI?
The right frequency depends on the facility's design, operating procedures, permit requirements, current process stability, and staffing. Many activated-sludge plants include settleability testing in their routine process-control program, often daily when close monitoring is needed. During a process upset, changing load condition, or declining clarifier performance, more frequent testing may be appropriate under the facility's approved operating procedures. The most useful practice is consistent testing and trending against the plant's own baseline.
What causes high SVI in wastewater treatment?
Elevated SVI is often associated with filamentous bacteria growth, but the root cause is process-specific. Different organisms are linked to different conditions - low dissolved oxygen, nutrient imbalance, septic or sulfide-bearing influent, high FOG loading, selector performance, changes in solids age, or shock loads. Toxicity events can also rapidly deteriorate settling. SVI alone does not identify the cause - microscopy and review of plant-specific process trends are needed to guide the response.
Can a high SVI cause a permit violation?
Not directly - SVI is a process-control parameter, not a permit limit. But clarifier performance shows up in effluent TSS, which is a permit parameter. A sustained bulking event that is not caught and corrected early can contribute to elevated effluent TSS on your monthly DMR. For activated-sludge plants, routine SVI trending can be a practical early-warning tool for deteriorating settleability and potential solids-loss risk.
See ComplyFlo in action
Manifests, compliance reporting, and billing in one platform built for waste operations.
Book a demo