Wastewater
Wastewater BOD Removal Efficiency Formula: How to Calculate It and What It Means for Your Permit
The BOD removal efficiency formula compares average influent and effluent concentrations for the parameter your permit specifies. Here is how the calculation works, why federal secondary treatment standards include an 85% removal requirement, and how to use month-to-date trends as an operational review tool.
October 19, 2026 · 5 min read
TL;DR
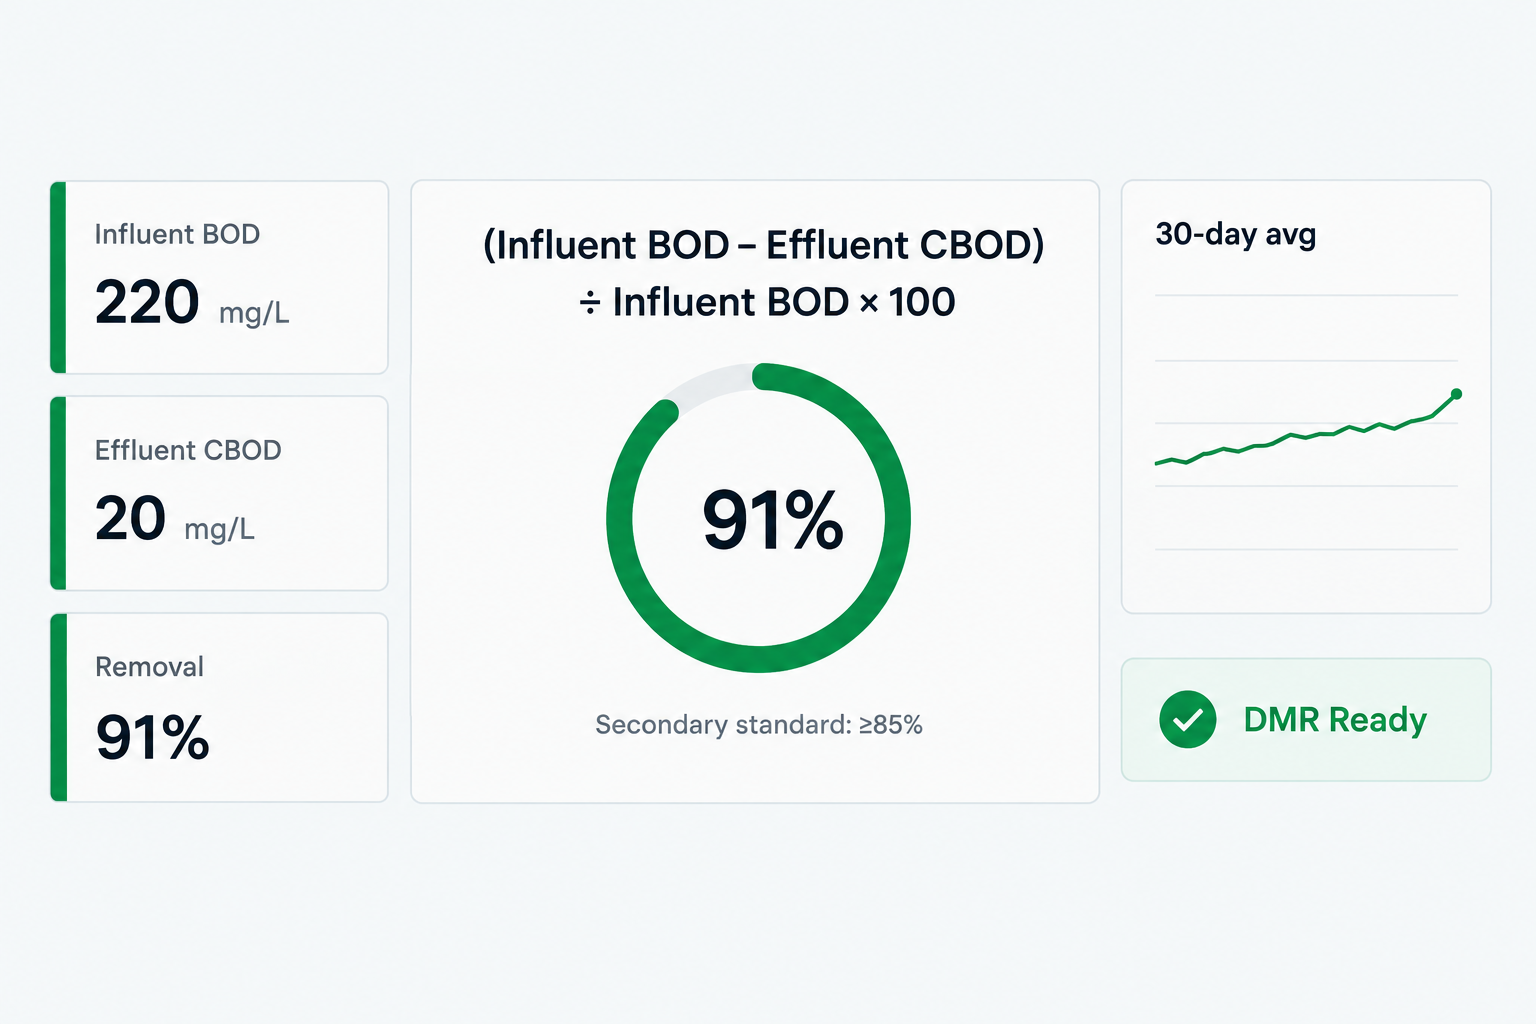
Removal efficiency compares the average influent and effluent concentrations for the parameter and reporting period your permit specifies: (C influent,avg − C effluent,avg) ÷ C influent,avg × 100, where C = concentration (mg/L). Federal secondary treatment standards under 40 CFR § 133.102 generally include an 85% removal requirement, subject to applicable exceptions and alternative standards - your permit controls the enforceable calculation and limits. Calculate removal from the period's average concentrations first, then apply the formula; averaging individual sample-pair percentages instead is not the same method and may produce a different result. Month-to-date and rolling trends are useful operational indicators - label them as preliminary, not as the final DMR value. ComplyFlo can help organize results, calculate configured metrics, and prepare draft reports for authorized review.
What is the BOD removal efficiency formula?
The wastewater BOD removal efficiency formula is a calculation reported on DMRs where the permit requires percent-removal reporting.
The general form is:
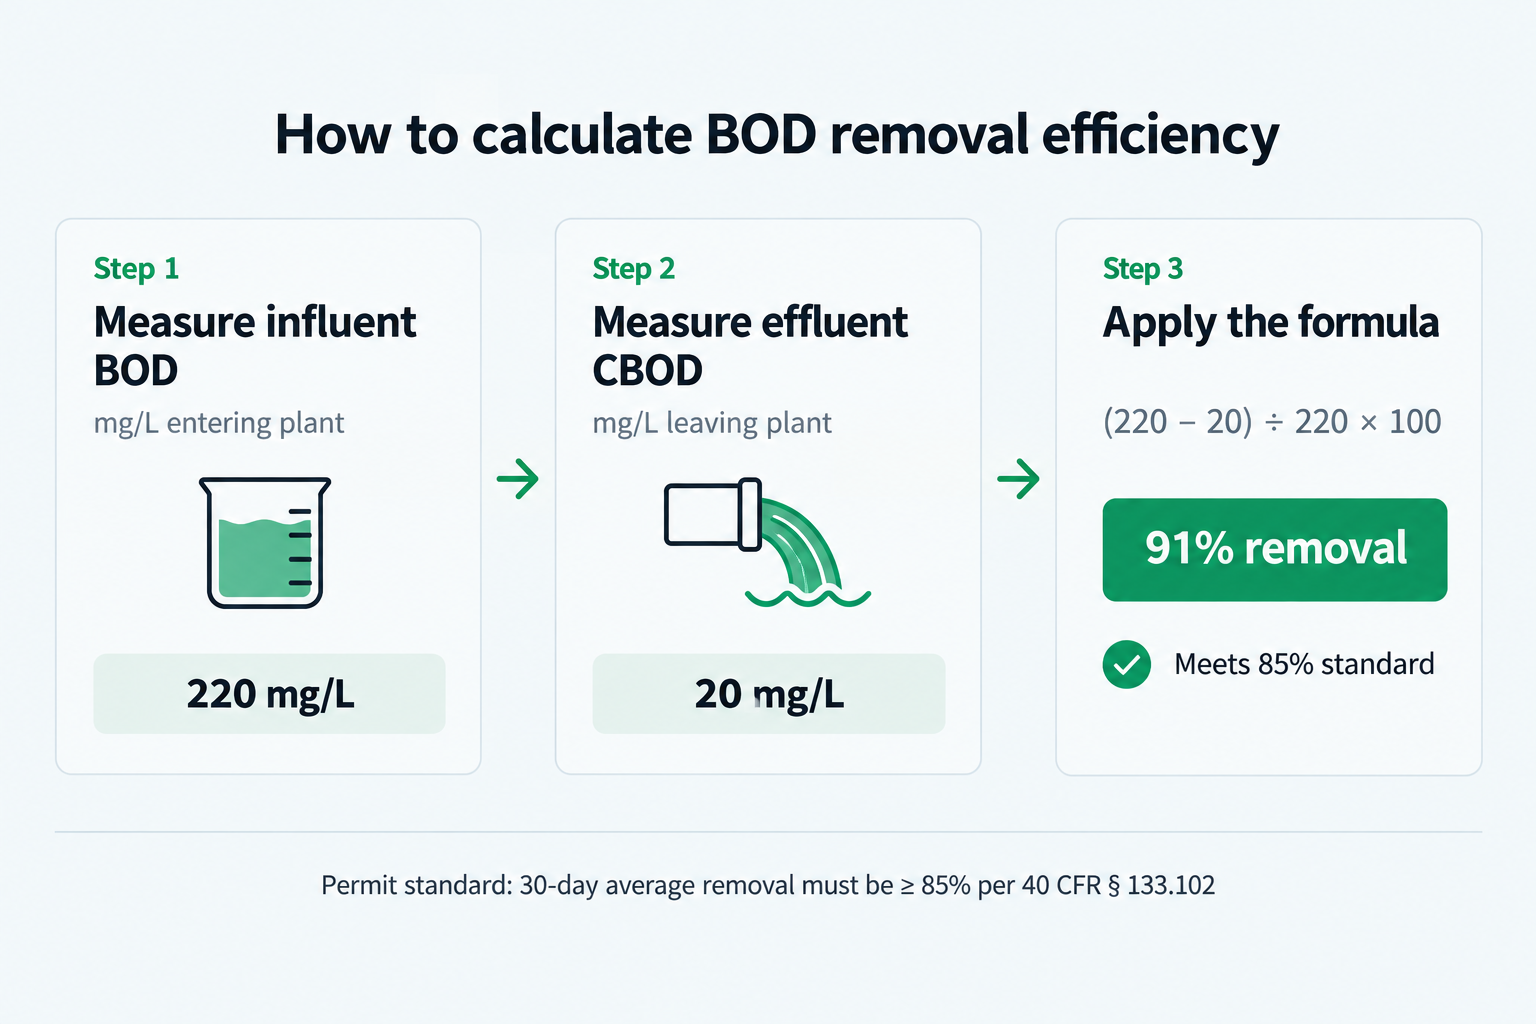
Removal efficiency (%) = (C influent,avg − C effluent,avg) ÷ C influent,avg × 100
Key: C = concentration (mg/L).
Where C influent,avg and C effluent,avg are the average influent and effluent concentrations for the applicable reporting period, measured in mg/L for the parameter your permit specifies.
40 CFR § 133.101(j) defines percent removal as the removal efficiency across the treatment plant, determined from the 30-day average values of raw wastewater influent concentrations and the 30-day average values of effluent concentrations. The calculation uses the two period averages first - it is not an average of individual daily removal percentages. Those two methods do not always produce the same result.
Your permit specifies the parameter (BOD5 or CBOD5), the sampling locations, the averaging period, and the calculation basis. Use those. Do not substitute effluent CBOD5 into a BOD5 removal calculation unless your permit or approved reporting instructions explicitly require that approach and identify it as a mixed-parameter basis.
A note on test timing: BOD5 and CBOD5 results are available only after the five-day laboratory test and processing. Results entered throughout the month reflect earlier sample dates - not the current day's treatment conditions.
Why do some permits use CBOD instead of BOD?
BOD5 and CBOD5 are different analytical parameters, and the distinction matters for how the formula is applied.
BOD5 measures total biochemical oxygen demand over five days, including both carbonaceous and nitrogenous oxygen demand. CBOD5 suppresses nitrification during the test by adding a nitrification inhibitor. This isolates carbonaceous oxygen demand and removes the variable of nitrifying bacteria from the measurement, producing a more stable indicator of secondary treatment performance.
Under 40 CFR § 133.102(a)(4), permitting authorities may substitute CBOD5 for BOD5. When they do, the effluent concentration limit is set at 25 mg/L 30-day average for CBOD5 rather than 30 mg/L for BOD5. The 85% removal standard applies to whichever parameter the permit specifies.
BOD5 and CBOD5 should not be treated as interchangeable. Use the influent and effluent parameters and calculation basis required by your permit or approved reporting instructions. Where a mixed BOD5/CBOD5 basis is expressly required, identify and apply that basis rather than substituting parameters on your own. Check your TPDES permit - it will specify which parameter applies, at which sampling locations, and using which averaging method.
A worked example of the formula
Here is a straightforward calculation to anchor the concept.
Assume a Texas WWTP has a permit requiring CBOD5 removal reporting. For a given reporting period, the sampling results produce these 30-day averages:
Parameter | Value |
|---|---|
Influent CBOD5 (30-day avg) | 220 mg/L |
Effluent CBOD5 (30-day avg) | 20 mg/L |
Applying the formula:
(220 − 20) ÷ 220 × 100 = 90.9% removal
This facility is meeting the applicable removal requirement with a buffer. That buffer matters. A facility running close to the 85% line has little margin before a bad period of results pushes the reporting-period average below the limit.
Now consider a different reporting period in which the completed 30-day average effluent CBOD5 is 35 mg/L rather than 20 mg/L - for example, because an aeration upset drove effluent concentrations higher across multiple sampling events during the period:
Parameter | Value |
|---|---|
Influent CBOD5 (30-day avg) | 220 mg/L |
Effluent CBOD5 (30-day avg) | 35 mg/L |
(220 − 35) ÷ 220 × 100 = 84.1% removal
If the permit specifies an 85% removal requirement and a 25 mg/L CBOD5 concentration limit, this completed-period result falls below the removal limit and exceeds the concentration limit. Both are independent requirements - meeting one does not satisfy the other.
Why is 85% the secondary treatment standard?
The 85% removal requirement comes from federal secondary treatment standards, not from a single permit condition.
40 CFR § 133.102 establishes secondary treatment requirements for publicly owned treatment works. For BOD5 or substituted CBOD5, the regulation specifies three parallel requirements:
30-day average effluent concentration: ≤ 30 mg/L (BOD5) or ≤ 25 mg/L (CBOD5)
7-day average effluent concentration: ≤ 45 mg/L (BOD5) or ≤ 40 mg/L (CBOD5)
30-day average percent removal: ≥ 85%
Concentration limits and the removal requirement are independent. Meeting the concentration limits alone is not sufficient if removal falls below the applicable requirement. Meeting the removal requirement does not satisfy a concentration limit that is also exceeded.
The regulation also recognizes case-specific adjustments. 40 CFR § 133.103 addresses situations involving less-concentrated influent and combined sewer conditions; § 133.105 addresses equivalent treatment. These are regulatory determinations that require permitting authority action - they are not exceptions operators apply on their own.
Your facility's enforceable limits and reporting requirements are those specified in your TPDES permit. The permit is the controlling document.
How to use month-to-date trends as an operational tool
Month-to-date calculations and rolling trends are not the same as the final DMR value - but they are useful for operational review when understood correctly.
A rolling 30-day calculation may include results from two calendar months. A month-to-date calculation is incomplete until the reporting period closes. Neither is automatically the final value for a monthly DMR. The permit-defined reporting period, valid monitoring results, required parameter basis, and prescribed averaging method determine the final calculation.
Use month-to-date and rolling values as preliminary operational indicators - clearly labeled as such. When available results trend in a direction that warrants investigation, investigate influent loading, aeration performance, and return sludge rates. Remember that BOD5 and CBOD5 results reflect the sample dates from the preceding five-day test window, not current conditions.
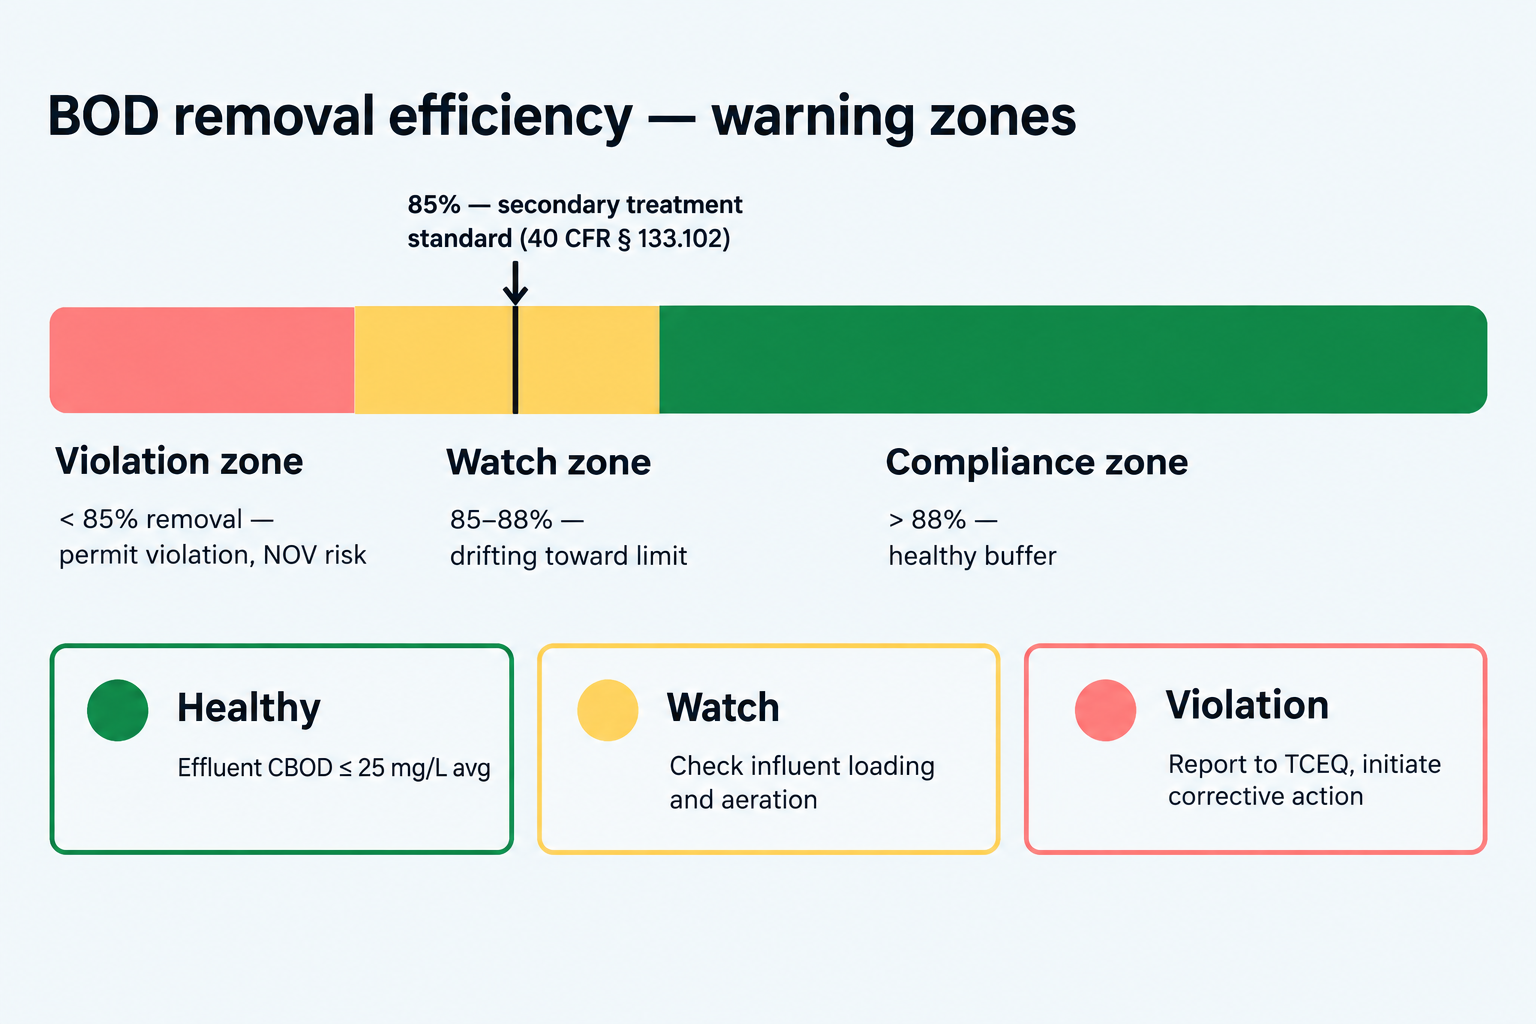
Three categories worth distinguishing in any monitoring dashboard:
Above the facility-selected operational buffer - removal is tracking above the configured warning threshold. Continue reviewing other permit requirements. An operational buffer is a facility-selected management target, not a regulatory threshold.
Near the applicable removal limit - available results are trending close to the limit. Investigate operating conditions and input quality. Determine whether a preliminary trend reflects a systemic issue or isolated sampling events.
Below the applicable removal limit - verify the calculation and determine whether it represents a preliminary trend or a completed reporting period. For a completed-period result, follow the applicable noncompliance reporting and response requirements under your permit.
A month-to-date result below 85% is not automatically a completed-period violation. The final DMR value depends on all valid samples for the required period, calculated using the permit-specified method.
How manual tracking creates risk for BOD compliance
At facilities that compile results only at month-end, emerging patterns can be harder to see before the reporting period closes.
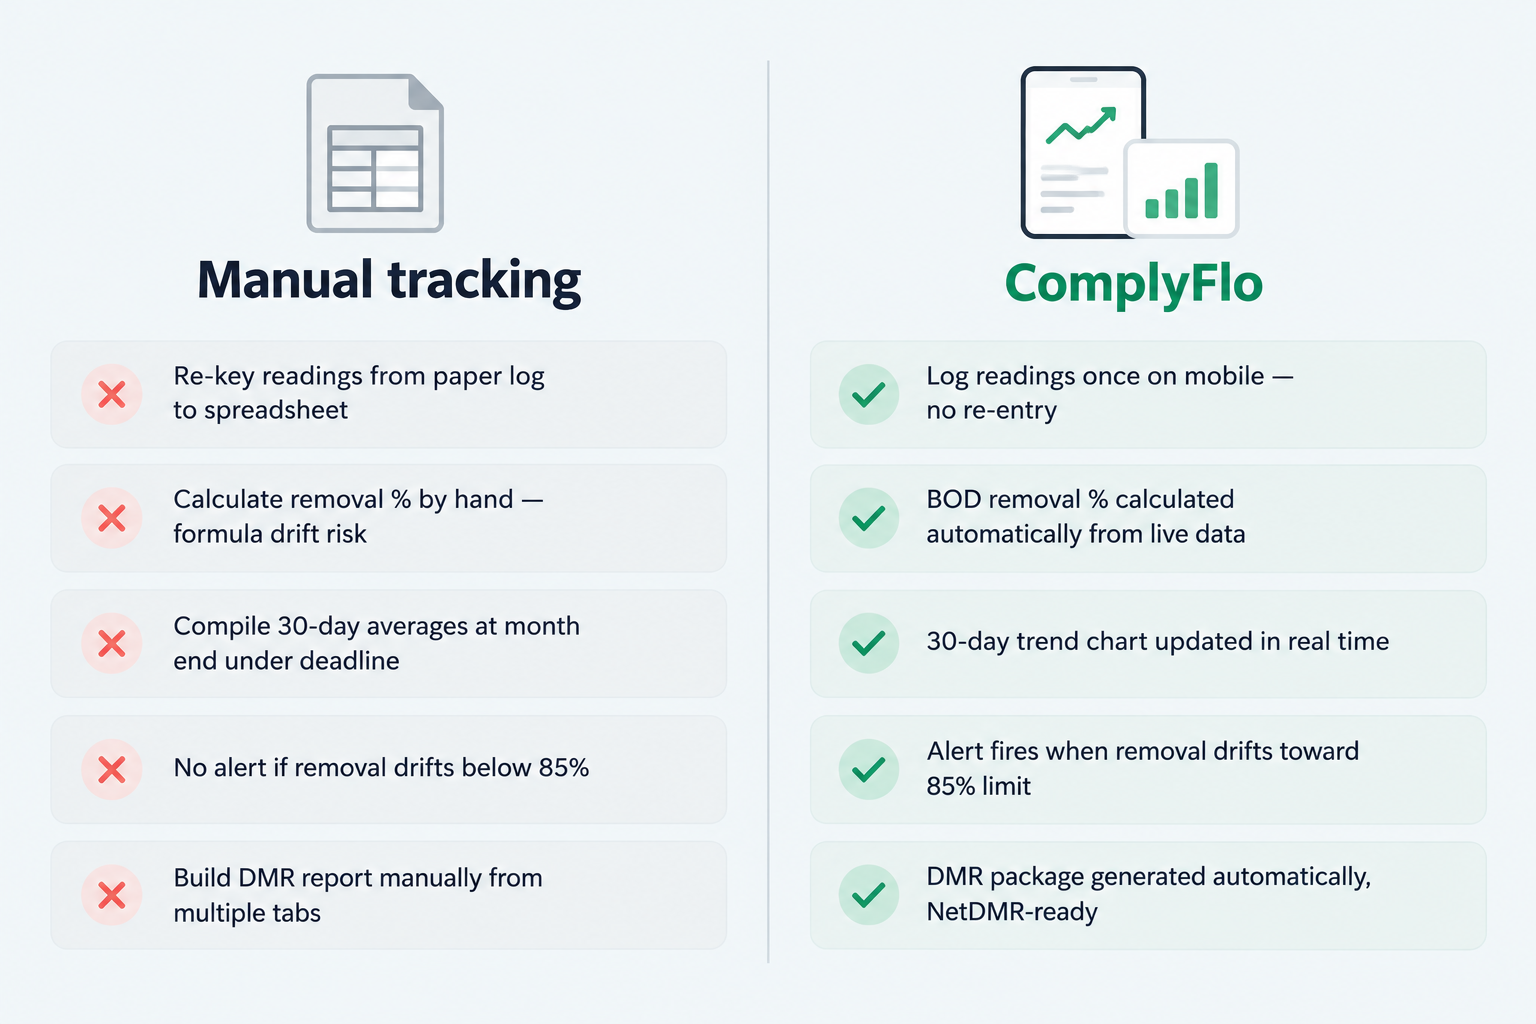
A common paper-based workflow looks like this:
Log influent and effluent samples in the paper logbook
Re-enter values into a spreadsheet at the end of the shift or end of the day
Compile 30-day averages at month-end when all results are available
Build the DMR from multiple spreadsheet tabs under deadline
This workflow has several failure points worth knowing.
Formula errors. A spreadsheet formula copied from one month's tab to the next can reference the wrong cell. The calculation looks right. The result is wrong. This kind of error may go undetected until a TCEQ reviewer asks a question.
Delayed pattern recognition. At facilities that compile results only at month-end, a trend in the available data may not be visible until the period is nearly closed. A maintained spreadsheet or digital platform can support earlier review when valid laboratory results are available - but the timing is still constrained by the five-day test window.
Re-entry errors. Every time a value moves from paper to spreadsheet, there is a transcription risk. A miskeyed effluent reading introduces error into every calculation that depends on it.
Try ComplyFlo
ComplyFlo is built for Texas wastewater operators. It includes a BOD removal efficiency calculator that applies the formula to your logged influent and effluent readings - no re-entry, no separate spreadsheet, no formula to maintain.
The calculator displays month-to-date and rolling trend results as operational indicators as laboratory results become available throughout the month. These are labeled as preliminary - separate from the completed reporting-period value prepared for authorized review. When the reporting period closes, ComplyFlo prepares a draft DMR package in NetDMR-ready format for review and certification before submission.
ComplyFlo also supports configured reminders and records for additional compliance obligations - SSO events, permit milestones, TPDES renewal windows, and operator CEU deadlines.
If your plant is managing BOD compliance in spreadsheets today, complyflowaste.com is worth a look.
Frequently Asked Questions
What is the wastewater BOD removal efficiency formula?
Percent removal is calculated as: (average influent concentration minus average effluent concentration) divided by average influent concentration, multiplied by 100. Use the parameter, sampling locations, averaging period, and concentration basis your permit specifies. 40 CFR § 133.101(j) defines percent removal using the 30-day average values of influent and effluent concentrations - not an average of individual sample-pair percentages.
Why is 85% the BOD removal standard for secondary treatment?
40 CFR § 133.102 establishes secondary treatment standards for publicly owned treatment works, including a general 85% removal requirement for applicable BOD or substituted CBOD. The regulation also recognizes case-specific adjustments under §§ 133.103 and 133.105. Your facility's enforceable limits and removal requirements are those specified in your TPDES permit.
What is the difference between BOD5 and CBOD5 on a DMR?
BOD5 measures total biochemical oxygen demand over 5 days, including both carbonaceous and nitrogenous oxygen demand. CBOD5 suppresses nitrification during the test and measures only carbonaceous BOD. Under 40 CFR § 133.102(a)(4), permitting authorities may substitute CBOD5 for BOD5. Do not substitute effluent CBOD5 into a BOD5 removal calculation unless your permit or approved reporting instructions explicitly require that mixed-parameter basis and identify it as such.
What happens if my plant falls below the applicable removal limit?
If the completed reporting-period result falls below the removal requirement in your permit, it may constitute noncompliance that must be addressed and reported under the permit's requirements. A month-to-date or rolling trend result below 85% is not automatically a completed-period violation - the permit-defined reporting period and averaging method control. TCEQ has authority to issue administrative orders, require permit modifications, and pursue civil liability for substantiated violations.
How can I use month-to-date trends before my DMR is due?
Calculate removal from available results as they come in throughout the month, using the average influent and effluent concentrations for the results on hand - not an average of individual sample-pair percentages. Label these as preliminary or month-to-date, since BOD5 and CBOD5 results become available only after the five-day test and laboratory processing. ComplyFlo supports configured metrics and trend displays as operational review tools, separate from the final certified DMR value.
Free checklist
TPDES Permit Compliance Checklist
Review permit-specific DMR submissions, sampling, SSO reporting, renewal milestones, and applicable pretreatment responsibilities.
Ready to move your plant logs and reports off paper?
Book a free 1-hour demo with a ComplyFlo team member and see it running on your own workflow.
Book a free demoGet TCEQ compliance updates
Deadline reminders, rule changes, and practical guides for Texas waste operators. No spam — unsubscribe anytime.
By subscribing you agree to receive emails from ComplyFlo. See our privacy policy.